Hydrocarboniphaga effusa AP103
Taxonomy: cellular organisms; Bacteria; Proteobacteria; Gammaproteobacteria; Nevskiales; Sinobacteraceae; Hydrocarboniphaga; Hydrocarboniphaga effusa
Average proteome isoelectric point is 6.74
Get precalculated fractions of proteins

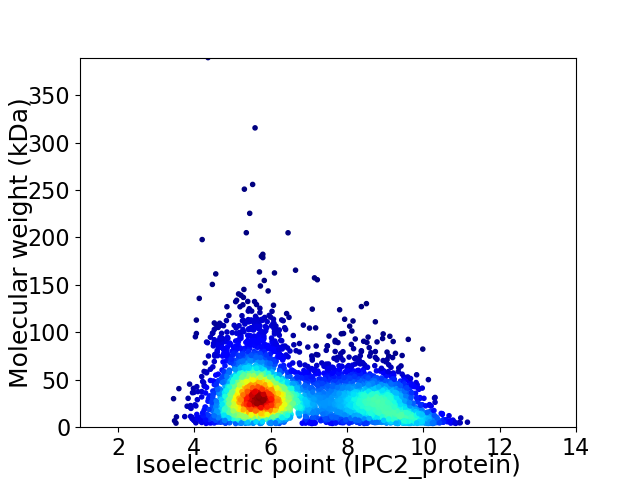
Virtual 2D-PAGE plot for 4474 proteins (isoelectric point calculated using IPC2_protein)
Get csv file with sequences according to given criteria:
* You can choose from 21 different methods for calculating isoelectric point
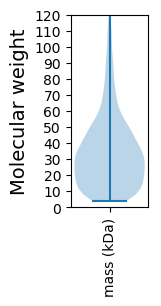
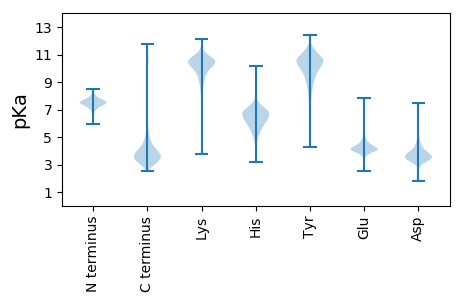
Summary statistics related to proteome-wise predictions


Protein with the lowest isoelectric point:
>tr|I8T5L1|I8T5L1_9GAMM LPS-assembly protein LptD OS=Hydrocarboniphaga effusa AP103 OX=1172194 GN=lptD PE=3 SV=1
MM1 pKa = 6.74RR2 pKa = 11.84TEE4 pKa = 4.5RR5 pKa = 11.84FCALSLVGALLCGCEE20 pKa = 4.13ASTSIDD26 pKa = 3.54FASAGYY32 pKa = 9.62AQADD36 pKa = 3.81QIMLAVEE43 pKa = 4.72GVDD46 pKa = 4.43LLDD49 pKa = 5.15DD50 pKa = 4.52GGSEE54 pKa = 4.94HH55 pKa = 6.97EE56 pKa = 4.99LDD58 pKa = 3.96SDD60 pKa = 4.06ADD62 pKa = 3.85SSFDD66 pKa = 3.82ALDD69 pKa = 3.54YY70 pKa = 11.6SNTDD74 pKa = 2.92TLQLVDD80 pKa = 4.21GTDD83 pKa = 3.52VAQGRR88 pKa = 11.84YY89 pKa = 7.26TGLRR93 pKa = 11.84LRR95 pKa = 11.84FSNEE99 pKa = 2.61GSALYY104 pKa = 10.06TSDD107 pKa = 2.97GAAYY111 pKa = 9.12PIDD114 pKa = 3.72IGSNLTFADD123 pKa = 3.25MDD125 pKa = 3.69MDD127 pKa = 4.43LDD129 pKa = 4.04EE130 pKa = 5.64GEE132 pKa = 4.25SGSRR136 pKa = 11.84LVIFEE141 pKa = 4.7PRR143 pKa = 11.84FSLQASTTTDD153 pKa = 2.36GHH155 pKa = 5.53YY156 pKa = 9.91TLTPVLRR163 pKa = 11.84VVHH166 pKa = 6.89PDD168 pKa = 2.91RR169 pKa = 11.84AASITGSVDD178 pKa = 3.35DD179 pKa = 4.17EE180 pKa = 4.49LVRR183 pKa = 11.84SSACRR188 pKa = 11.84QSRR191 pKa = 11.84TLGSGVAVYY200 pKa = 10.73AFVGANVTPQDD211 pKa = 3.82YY212 pKa = 10.21QRR214 pKa = 11.84SSGASPVAAADD225 pKa = 3.65VKK227 pKa = 10.46TGDD230 pKa = 4.5DD231 pKa = 3.77GASFYY236 pKa = 11.49YY237 pKa = 10.41DD238 pKa = 3.91FPYY241 pKa = 9.62LTAGTYY247 pKa = 8.8TLAVTCNADD256 pKa = 3.35SEE258 pKa = 4.78NPGRR262 pKa = 11.84NDD264 pKa = 3.1GLGFLAQSSVTVEE277 pKa = 4.06EE278 pKa = 4.8NEE280 pKa = 4.28SQTVNLAEE288 pKa = 4.03
MM1 pKa = 6.74RR2 pKa = 11.84TEE4 pKa = 4.5RR5 pKa = 11.84FCALSLVGALLCGCEE20 pKa = 4.13ASTSIDD26 pKa = 3.54FASAGYY32 pKa = 9.62AQADD36 pKa = 3.81QIMLAVEE43 pKa = 4.72GVDD46 pKa = 4.43LLDD49 pKa = 5.15DD50 pKa = 4.52GGSEE54 pKa = 4.94HH55 pKa = 6.97EE56 pKa = 4.99LDD58 pKa = 3.96SDD60 pKa = 4.06ADD62 pKa = 3.85SSFDD66 pKa = 3.82ALDD69 pKa = 3.54YY70 pKa = 11.6SNTDD74 pKa = 2.92TLQLVDD80 pKa = 4.21GTDD83 pKa = 3.52VAQGRR88 pKa = 11.84YY89 pKa = 7.26TGLRR93 pKa = 11.84LRR95 pKa = 11.84FSNEE99 pKa = 2.61GSALYY104 pKa = 10.06TSDD107 pKa = 2.97GAAYY111 pKa = 9.12PIDD114 pKa = 3.72IGSNLTFADD123 pKa = 3.25MDD125 pKa = 3.69MDD127 pKa = 4.43LDD129 pKa = 4.04EE130 pKa = 5.64GEE132 pKa = 4.25SGSRR136 pKa = 11.84LVIFEE141 pKa = 4.7PRR143 pKa = 11.84FSLQASTTTDD153 pKa = 2.36GHH155 pKa = 5.53YY156 pKa = 9.91TLTPVLRR163 pKa = 11.84VVHH166 pKa = 6.89PDD168 pKa = 2.91RR169 pKa = 11.84AASITGSVDD178 pKa = 3.35DD179 pKa = 4.17EE180 pKa = 4.49LVRR183 pKa = 11.84SSACRR188 pKa = 11.84QSRR191 pKa = 11.84TLGSGVAVYY200 pKa = 10.73AFVGANVTPQDD211 pKa = 3.82YY212 pKa = 10.21QRR214 pKa = 11.84SSGASPVAAADD225 pKa = 3.65VKK227 pKa = 10.46TGDD230 pKa = 4.5DD231 pKa = 3.77GASFYY236 pKa = 11.49YY237 pKa = 10.41DD238 pKa = 3.91FPYY241 pKa = 9.62LTAGTYY247 pKa = 8.8TLAVTCNADD256 pKa = 3.35SEE258 pKa = 4.78NPGRR262 pKa = 11.84NDD264 pKa = 3.1GLGFLAQSSVTVEE277 pKa = 4.06EE278 pKa = 4.8NEE280 pKa = 4.28SQTVNLAEE288 pKa = 4.03
Molecular weight: 30.44 kDa
Isoelectric point according different methods:
Protein with the highest isoelectric point:
>tr|I8TD70|I8TD70_9GAMM Uncharacterized protein OS=Hydrocarboniphaga effusa AP103 OX=1172194 GN=WQQ_20670 PE=4 SV=1
MM1 pKa = 7.28KK2 pKa = 9.38RR3 pKa = 11.84TYY5 pKa = 9.98QPHH8 pKa = 5.24SLRR11 pKa = 11.84RR12 pKa = 11.84KK13 pKa = 7.45RR14 pKa = 11.84THH16 pKa = 6.03GFRR19 pKa = 11.84ARR21 pKa = 11.84MATVGGRR28 pKa = 11.84KK29 pKa = 9.01VLARR33 pKa = 11.84RR34 pKa = 11.84RR35 pKa = 11.84AKK37 pKa = 10.32GRR39 pKa = 11.84ARR41 pKa = 11.84LTPVV45 pKa = 2.71
MM1 pKa = 7.28KK2 pKa = 9.38RR3 pKa = 11.84TYY5 pKa = 9.98QPHH8 pKa = 5.24SLRR11 pKa = 11.84RR12 pKa = 11.84KK13 pKa = 7.45RR14 pKa = 11.84THH16 pKa = 6.03GFRR19 pKa = 11.84ARR21 pKa = 11.84MATVGGRR28 pKa = 11.84KK29 pKa = 9.01VLARR33 pKa = 11.84RR34 pKa = 11.84RR35 pKa = 11.84AKK37 pKa = 10.32GRR39 pKa = 11.84ARR41 pKa = 11.84LTPVV45 pKa = 2.71
Molecular weight: 5.29 kDa
Isoelectric point according different methods:
Peptides (in silico digests for buttom-up proteomics)
Below you can find in silico digests of the whole proteome with Trypsin, Chymotrypsin, Trypsin+LysC, LysN, ArgC proteases suitable for different mass spec machines.| Try ESI |
 |
|---|
| ChTry ESI |
 |
|---|
| ArgC ESI |
 |
|---|
| LysN ESI |
 |
|---|
| TryLysC ESI |
 |
|---|
| Try MALDI |
 |
|---|
| ChTry MALDI |
 |
|---|
| ArgC MALDI |
 |
|---|
| LysN MALDI |
 |
|---|
| TryLysC MALDI |
 |
|---|
| Try LTQ |
 |
|---|
| ChTry LTQ |
 |
|---|
| ArgC LTQ |
 |
|---|
| LysN LTQ |
 |
|---|
| TryLysC LTQ |
 |
|---|
| Try MSlow |
 |
|---|
| ChTry MSlow |
 |
|---|
| ArgC MSlow |
 |
|---|
| LysN MSlow |
 |
|---|
| TryLysC MSlow |
 |
|---|
| Try MShigh |
 |
|---|
| ChTry MShigh |
 |
|---|
| ArgC MShigh |
 |
|---|
| LysN MShigh |
 |
|---|
| TryLysC MShigh |
 |
|---|
General Statistics
Number of major isoforms |
Number of additional isoforms |
Number of all proteins |
Number of amino acids |
Min. Seq. Length |
Max. Seq. Length |
Avg. Seq. Length |
Avg. Mol. Weight |
|---|---|---|---|---|---|---|---|
0 |
1483553 |
37 |
3837 |
331.6 |
36.13 |
Amino acid frequency
Ala |
Cys |
Asp |
Glu |
Phe |
Gly |
His |
Ile |
Lys |
Leu |
|---|---|---|---|---|---|---|---|---|---|
12.144 ± 0.043 | 0.882 ± 0.012 |
5.608 ± 0.024 | 5.631 ± 0.035 |
3.505 ± 0.02 | 8.316 ± 0.041 |
2.063 ± 0.018 | 4.636 ± 0.025 |
3.219 ± 0.033 | 10.809 ± 0.041 |
Met |
Asn |
Gln |
Pro |
Arg |
Ser |
Thr |
Val |
Trp |
Tyr |
|---|---|---|---|---|---|---|---|---|---|
2.102 ± 0.019 | 2.685 ± 0.024 |
5.145 ± 0.023 | 3.821 ± 0.024 |
7.431 ± 0.043 | 6.024 ± 0.033 |
4.953 ± 0.028 | 7.138 ± 0.031 |
1.405 ± 0.015 | 2.482 ± 0.018 |
Most of the basic statistics you can see at this page can be downloaded from this CSV file
Proteome-pI is available under Creative Commons Attribution-NoDerivs license, for more details see here
| Reference: Kozlowski LP. Proteome-pI 2.0: Proteome Isoelectric Point Database Update. Nucleic Acids Res. 2021, doi: 10.1093/nar/gkab944 | Contact: Lukasz P. Kozlowski |
