Armadillidium vulgare (Pillbug) (Pill woodlouse)
Taxonomy: cellular organisms; Eukaryota; Opisthokonta; Metazoa; Eumetazoa; Bilateria; Protostomia; Ecdysozoa; Panarthropoda; Arthropoda; Mandibulata; Pancrustacea; Crustacea; Multicrustacea; Malacostraca; Eumalacostraca; Peracarida; Isopoda; Oniscidea; Crinocheta; Armadillidiidae; Armadillidium
Average proteome isoelectric point is 6.85
Get precalculated fractions of proteins

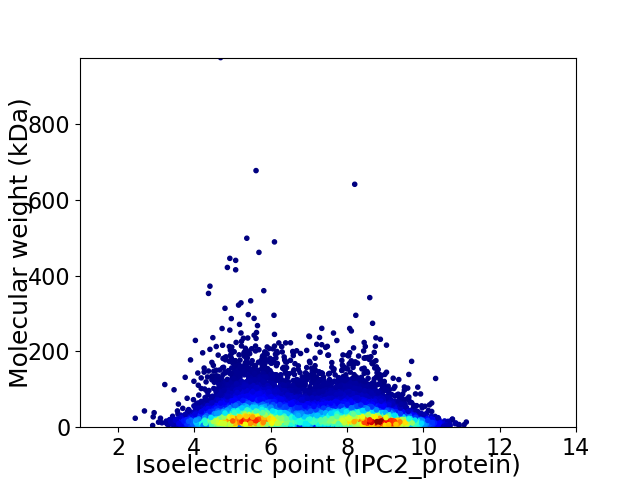
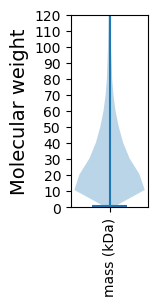
Virtual 2D-PAGE plot for 18774 proteins (isoelectric point calculated using IPC2_protein)
Get csv file with sequences according to given criteria:
* You can choose from 21 different methods for calculating isoelectric point
Summary statistics related to proteome-wise predictions


Protein with the lowest isoelectric point:
>tr|A0A444TH49|A0A444TH49_ARMVU Lupus La protein-like OS=Armadillidium vulgare OX=13347 GN=Avbf_06439 PE=4 SV=1
MM1 pKa = 6.92VASGTSRR8 pKa = 11.84MAFQLSAGAEE18 pKa = 3.97EE19 pKa = 4.97IVPNMDD25 pKa = 3.46KK26 pKa = 10.73TFTCDD31 pKa = 3.31DD32 pKa = 3.27KK33 pKa = 11.61HH34 pKa = 7.56YY35 pKa = 10.84GYY37 pKa = 11.07YY38 pKa = 10.75ADD40 pKa = 4.72VNNNCQVFHH49 pKa = 6.58VCLPVPKK56 pKa = 10.48DD57 pKa = 3.35VGEE60 pKa = 4.23EE61 pKa = 4.07NNVEE65 pKa = 4.05QFSFVCGNEE74 pKa = 4.04TVFNQEE80 pKa = 3.78TLTCTFTQDD89 pKa = 4.74SIPCEE94 pKa = 4.07DD95 pKa = 3.52SEE97 pKa = 6.25KK98 pKa = 10.69YY99 pKa = 10.41FSLNEE104 pKa = 3.7EE105 pKa = 4.19FGRR108 pKa = 11.84ILKK111 pKa = 9.94GRR113 pKa = 11.84SGLASGGLTTEE124 pKa = 3.93NSLFADD130 pKa = 3.69SGANQVSDD138 pKa = 3.28SGANQVIDD146 pKa = 3.61SGANQALDD154 pKa = 3.37SGANQALDD162 pKa = 3.37SGANQALDD170 pKa = 3.37SGANQALDD178 pKa = 3.37SGANQALDD186 pKa = 3.34SGANQAIDD194 pKa = 3.34SGANQALDD202 pKa = 3.27SGANQVPDD210 pKa = 3.34SDD212 pKa = 4.6ANQILDD218 pKa = 3.56SGANQILDD226 pKa = 3.5SGANQVLDD234 pKa = 3.69SGVNN238 pKa = 3.25
MM1 pKa = 6.92VASGTSRR8 pKa = 11.84MAFQLSAGAEE18 pKa = 3.97EE19 pKa = 4.97IVPNMDD25 pKa = 3.46KK26 pKa = 10.73TFTCDD31 pKa = 3.31DD32 pKa = 3.27KK33 pKa = 11.61HH34 pKa = 7.56YY35 pKa = 10.84GYY37 pKa = 11.07YY38 pKa = 10.75ADD40 pKa = 4.72VNNNCQVFHH49 pKa = 6.58VCLPVPKK56 pKa = 10.48DD57 pKa = 3.35VGEE60 pKa = 4.23EE61 pKa = 4.07NNVEE65 pKa = 4.05QFSFVCGNEE74 pKa = 4.04TVFNQEE80 pKa = 3.78TLTCTFTQDD89 pKa = 4.74SIPCEE94 pKa = 4.07DD95 pKa = 3.52SEE97 pKa = 6.25KK98 pKa = 10.69YY99 pKa = 10.41FSLNEE104 pKa = 3.7EE105 pKa = 4.19FGRR108 pKa = 11.84ILKK111 pKa = 9.94GRR113 pKa = 11.84SGLASGGLTTEE124 pKa = 3.93NSLFADD130 pKa = 3.69SGANQVSDD138 pKa = 3.28SGANQVIDD146 pKa = 3.61SGANQALDD154 pKa = 3.37SGANQALDD162 pKa = 3.37SGANQALDD170 pKa = 3.37SGANQALDD178 pKa = 3.37SGANQALDD186 pKa = 3.34SGANQAIDD194 pKa = 3.34SGANQALDD202 pKa = 3.27SGANQVPDD210 pKa = 3.34SDD212 pKa = 4.6ANQILDD218 pKa = 3.56SGANQILDD226 pKa = 3.5SGANQVLDD234 pKa = 3.69SGVNN238 pKa = 3.25
Molecular weight: 24.77 kDa
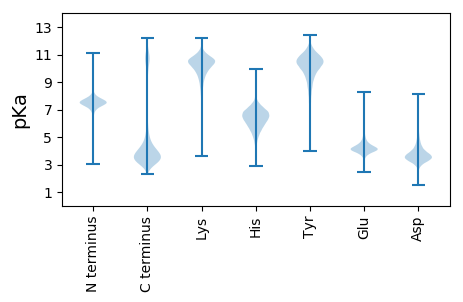
Isoelectric point according different methods:
Protein with the highest isoelectric point:
>tr|A0A444T7U4|A0A444T7U4_ARMVU Uncharacterized protein OS=Armadillidium vulgare OX=13347 GN=Avbf_14218 PE=4 SV=1
MM1 pKa = 7.87AILKK5 pKa = 8.17LTLSFLLLVLVTFTNAQFRR24 pKa = 11.84GGGGRR29 pKa = 11.84GGVAGNIAGSNSPSARR45 pKa = 11.84TFGGAGGGIFGNLFQTGLGLFSSLLGGGGFGRR77 pKa = 11.84PGFGGQGFGRR87 pKa = 11.84PGGFGGAGFGRR98 pKa = 11.84PGAFGGPFGFGGPGQFGNGGFGPGRR123 pKa = 11.84FRR125 pKa = 11.84PGGFGPGGFGPSRR138 pKa = 11.84FGPSS142 pKa = 2.61
MM1 pKa = 7.87AILKK5 pKa = 8.17LTLSFLLLVLVTFTNAQFRR24 pKa = 11.84GGGGRR29 pKa = 11.84GGVAGNIAGSNSPSARR45 pKa = 11.84TFGGAGGGIFGNLFQTGLGLFSSLLGGGGFGRR77 pKa = 11.84PGFGGQGFGRR87 pKa = 11.84PGGFGGAGFGRR98 pKa = 11.84PGAFGGPFGFGGPGQFGNGGFGPGRR123 pKa = 11.84FRR125 pKa = 11.84PGGFGPGGFGPSRR138 pKa = 11.84FGPSS142 pKa = 2.61
Molecular weight: 13.6 kDa
Isoelectric point according different methods:
Peptides (in silico digests for buttom-up proteomics)
Below you can find in silico digests of the whole proteome with Trypsin, Chymotrypsin, Trypsin+LysC, LysN, ArgC proteases suitable for different mass spec machines.| Try ESI |
 |
|---|
| ChTry ESI |
 |
|---|
| ArgC ESI |
 |
|---|
| LysN ESI |
 |
|---|
| TryLysC ESI |
 |
|---|
| Try MALDI |
 |
|---|
| ChTry MALDI |
 |
|---|
| ArgC MALDI |
 |
|---|
| LysN MALDI |
 |
|---|
| TryLysC MALDI |
 |
|---|
| Try LTQ |
 |
|---|
| ChTry LTQ |
 |
|---|
| ArgC LTQ |
 |
|---|
| LysN LTQ |
 |
|---|
| TryLysC LTQ |
 |
|---|
| Try MSlow |
 |
|---|
| ChTry MSlow |
 |
|---|
| ArgC MSlow |
 |
|---|
| LysN MSlow |
 |
|---|
| TryLysC MSlow |
 |
|---|
| Try MShigh |
 |
|---|
| ChTry MShigh |
 |
|---|
| ArgC MShigh |
 |
|---|
| LysN MShigh |
 |
|---|
| TryLysC MShigh |
 |
|---|
General Statistics
Number of major isoforms |
Number of additional isoforms |
Number of all proteins |
Number of amino acids |
Min. Seq. Length |
Max. Seq. Length |
Avg. Seq. Length |
Avg. Mol. Weight |
|---|---|---|---|---|---|---|---|
0 |
5621995 |
8 |
9071 |
299.5 |
33.91 |
Amino acid frequency
Ala |
Cys |
Asp |
Glu |
Phe |
Gly |
His |
Ile |
Lys |
Leu |
|---|---|---|---|---|---|---|---|---|---|
4.838 ± 0.019 | 2.035 ± 0.02 |
5.239 ± 0.018 | 7.137 ± 0.023 |
4.455 ± 0.019 | 5.325 ± 0.027 |
2.405 ± 0.012 | 6.303 ± 0.019 |
7.415 ± 0.026 | 9.093 ± 0.026 |
Met |
Asn |
Gln |
Pro |
Arg |
Ser |
Thr |
Val |
Trp |
Tyr |
|---|---|---|---|---|---|---|---|---|---|
2.192 ± 0.011 | 5.537 ± 0.022 |
4.826 ± 0.031 | 3.67 ± 0.019 |
4.786 ± 0.018 | 9.179 ± 0.037 |
5.456 ± 0.02 | 5.798 ± 0.015 |
0.993 ± 0.007 | 3.316 ± 0.014 |
Most of the basic statistics you can see at this page can be downloaded from this CSV file
Proteome-pI is available under Creative Commons Attribution-NoDerivs license, for more details see here
| Reference: Kozlowski LP. Proteome-pI 2.0: Proteome Isoelectric Point Database Update. Nucleic Acids Res. 2021, doi: 10.1093/nar/gkab944 | Contact: Lukasz P. Kozlowski |
