Candida tenuis (strain ATCC 10573 / BCRC 21748 / CBS 615 / JCM 9827 / NBRC 10315 / NRRL Y-1498 / VKM Y-70) (Yeast) (Yamadazyma tenuis)
Taxonomy: cellular organisms; Eukaryota; Opisthokonta; Fungi; Dikarya; Ascomycota; saccharomyceta; Saccharomycotina; Saccharomycetes; Saccharomycetales; Debaryomycetaceae; Yamadazyma; Yamadazyma tenuis
Average proteome isoelectric point is 6.37
Get precalculated fractions of proteins

Virtual 2D-PAGE plot for 6051 proteins (isoelectric point calculated using IPC2_protein)
Get csv file with sequences according to given criteria:
* You can choose from 21 different methods for calculating isoelectric point
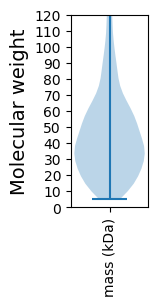
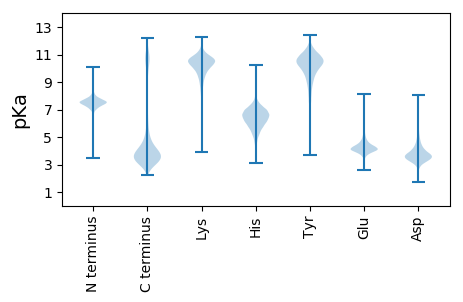
Summary statistics related to proteome-wise predictions


Protein with the lowest isoelectric point:
>tr|G3AZX4|G3AZX4_CANTC GYF domain-containing protein OS=Candida tenuis (strain ATCC 10573 / BCRC 21748 / CBS 615 / JCM 9827 / NBRC 10315 / NRRL Y-1498 / VKM Y-70) OX=590646 GN=CANTEDRAFT_92490 PE=4 SV=1
MM1 pKa = 7.38KK2 pKa = 9.8FAAAIALLASVCAVQAADD20 pKa = 3.86SEE22 pKa = 4.79DD23 pKa = 3.61VAFLTNLVQDD33 pKa = 4.54YY34 pKa = 10.44KK35 pKa = 11.61SHH37 pKa = 5.84TADD40 pKa = 3.06YY41 pKa = 11.12AKK43 pKa = 10.53FIRR46 pKa = 11.84TASSVPAVITSLALHH61 pKa = 6.21VATYY65 pKa = 10.47TDD67 pKa = 3.21TSYY70 pKa = 7.64TTLLDD75 pKa = 3.94NNGLDD80 pKa = 3.61IDD82 pKa = 4.22SLEE85 pKa = 4.5DD86 pKa = 3.66FATEE90 pKa = 4.09LPWYY94 pKa = 10.14SSRR97 pKa = 11.84LLVADD102 pKa = 4.67ADD104 pKa = 3.95ASEE107 pKa = 4.93SGDD110 pKa = 3.63ASEE113 pKa = 5.07TDD115 pKa = 3.35ASDD118 pKa = 3.56ASSTEE123 pKa = 3.92ASSSAASSAASSAASSSAASSSEE146 pKa = 3.7AGAAAMMAPIGALLGAAAIALMM168 pKa = 4.57
MM1 pKa = 7.38KK2 pKa = 9.8FAAAIALLASVCAVQAADD20 pKa = 3.86SEE22 pKa = 4.79DD23 pKa = 3.61VAFLTNLVQDD33 pKa = 4.54YY34 pKa = 10.44KK35 pKa = 11.61SHH37 pKa = 5.84TADD40 pKa = 3.06YY41 pKa = 11.12AKK43 pKa = 10.53FIRR46 pKa = 11.84TASSVPAVITSLALHH61 pKa = 6.21VATYY65 pKa = 10.47TDD67 pKa = 3.21TSYY70 pKa = 7.64TTLLDD75 pKa = 3.94NNGLDD80 pKa = 3.61IDD82 pKa = 4.22SLEE85 pKa = 4.5DD86 pKa = 3.66FATEE90 pKa = 4.09LPWYY94 pKa = 10.14SSRR97 pKa = 11.84LLVADD102 pKa = 4.67ADD104 pKa = 3.95ASEE107 pKa = 4.93SGDD110 pKa = 3.63ASEE113 pKa = 5.07TDD115 pKa = 3.35ASDD118 pKa = 3.56ASSTEE123 pKa = 3.92ASSSAASSAASSAASSSAASSSEE146 pKa = 3.7AGAAAMMAPIGALLGAAAIALMM168 pKa = 4.57
Molecular weight: 16.83 kDa
Isoelectric point according different methods:
Protein with the highest isoelectric point:
>tr|G3BAR6|G3BAR6_CANTC MFS general substrate transporter OS=Candida tenuis (strain ATCC 10573 / BCRC 21748 / CBS 615 / JCM 9827 / NBRC 10315 / NRRL Y-1498 / VKM Y-70) OX=590646 GN=CANTEDRAFT_131515 PE=4 SV=1
MM1 pKa = 7.72AGLSTVVASLNRR13 pKa = 11.84KK14 pKa = 8.54VVTSSSRR21 pKa = 11.84PTVLRR26 pKa = 11.84NMAGLSTSVTLGVVGLTVSGKK47 pKa = 7.11MVRR50 pKa = 11.84TSTLVTGGRR59 pKa = 11.84RR60 pKa = 11.84LEE62 pKa = 4.14LRR64 pKa = 11.84SSRR67 pKa = 11.84SRR69 pKa = 11.84RR70 pKa = 11.84WLFSSRR76 pKa = 11.84SIAVLRR82 pKa = 11.84YY83 pKa = 8.35VAKK86 pKa = 9.34LTTIVTLGTLFLSWTVRR103 pKa = 11.84LNMSHH108 pKa = 6.75ITTQVTLFMGGQFWFLTFF126 pKa = 4.14
MM1 pKa = 7.72AGLSTVVASLNRR13 pKa = 11.84KK14 pKa = 8.54VVTSSSRR21 pKa = 11.84PTVLRR26 pKa = 11.84NMAGLSTSVTLGVVGLTVSGKK47 pKa = 7.11MVRR50 pKa = 11.84TSTLVTGGRR59 pKa = 11.84RR60 pKa = 11.84LEE62 pKa = 4.14LRR64 pKa = 11.84SSRR67 pKa = 11.84SRR69 pKa = 11.84RR70 pKa = 11.84WLFSSRR76 pKa = 11.84SIAVLRR82 pKa = 11.84YY83 pKa = 8.35VAKK86 pKa = 9.34LTTIVTLGTLFLSWTVRR103 pKa = 11.84LNMSHH108 pKa = 6.75ITTQVTLFMGGQFWFLTFF126 pKa = 4.14
Molecular weight: 13.84 kDa
Isoelectric point according different methods:
Peptides (in silico digests for buttom-up proteomics)
Below you can find in silico digests of the whole proteome with Trypsin, Chymotrypsin, Trypsin+LysC, LysN, ArgC proteases suitable for different mass spec machines.| Try ESI |
 |
|---|
| ChTry ESI |
 |
|---|
| ArgC ESI |
 |
|---|
| LysN ESI |
 |
|---|
| TryLysC ESI |
 |
|---|
| Try MALDI |
 |
|---|
| ChTry MALDI |
 |
|---|
| ArgC MALDI |
 |
|---|
| LysN MALDI |
 |
|---|
| TryLysC MALDI |
 |
|---|
| Try LTQ |
 |
|---|
| ChTry LTQ |
 |
|---|
| ArgC LTQ |
 |
|---|
| LysN LTQ |
 |
|---|
| TryLysC LTQ |
 |
|---|
| Try MSlow |
 |
|---|
| ChTry MSlow |
 |
|---|
| ArgC MSlow |
 |
|---|
| LysN MSlow |
 |
|---|
| TryLysC MSlow |
 |
|---|
| Try MShigh |
 |
|---|
| ChTry MShigh |
 |
|---|
| ArgC MShigh |
 |
|---|
| LysN MShigh |
 |
|---|
| TryLysC MShigh |
 |
|---|
General Statistics
Number of major isoforms |
Number of additional isoforms |
Number of all proteins |
Number of amino acids |
Min. Seq. Length |
Max. Seq. Length |
Avg. Seq. Length |
Avg. Mol. Weight |
|---|---|---|---|---|---|---|---|
2636551 |
51 |
4087 |
435.7 |
49.15 |
Amino acid frequency
Ala |
Cys |
Asp |
Glu |
Phe |
Gly |
His |
Ile |
Lys |
Leu |
|---|---|---|---|---|---|---|---|---|---|
5.588 ± 0.032 | 1.163 ± 0.011 |
5.977 ± 0.023 | 6.218 ± 0.026 |
4.794 ± 0.021 | 5.397 ± 0.03 |
2.205 ± 0.014 | 6.563 ± 0.024 |
6.915 ± 0.025 | 9.707 ± 0.034 |
Met |
Asn |
Gln |
Pro |
Arg |
Ser |
Thr |
Val |
Trp |
Tyr |
|---|---|---|---|---|---|---|---|---|---|
2.032 ± 0.01 | 5.678 ± 0.03 |
4.439 ± 0.025 | 3.769 ± 0.017 |
4.134 ± 0.019 | 8.874 ± 0.032 |
5.542 ± 0.019 | 6.303 ± 0.024 |
1.075 ± 0.01 | 3.629 ± 0.017 |
Most of the basic statistics you can see at this page can be downloaded from this CSV file
Proteome-pI is available under Creative Commons Attribution-NoDerivs license, for more details see here
| Reference: Kozlowski LP. Proteome-pI 2.0: Proteome Isoelectric Point Database Update. Nucleic Acids Res. 2021, doi: 10.1093/nar/gkab944 | Contact: Lukasz P. Kozlowski |
