Lactobacillus sakei subsp. sakei (strain 23K)
Taxonomy: cellular organisms; Bacteria; Terrabacteria group; Firmicutes; Bacilli; Lactobacillales; Lactobacillaceae; Latilactobacillus; Latilactobacillus sakei; Latilactobacillus sakei subsp. sakei
Average proteome isoelectric point is 6.51
Get precalculated fractions of proteins

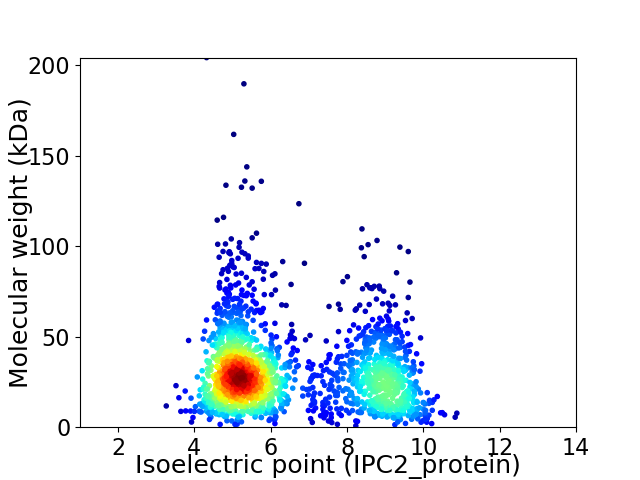
Virtual 2D-PAGE plot for 1872 proteins (isoelectric point calculated using IPC2_protein)
Get csv file with sequences according to given criteria:
* You can choose from 21 different methods for calculating isoelectric point
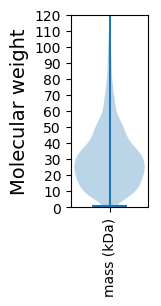
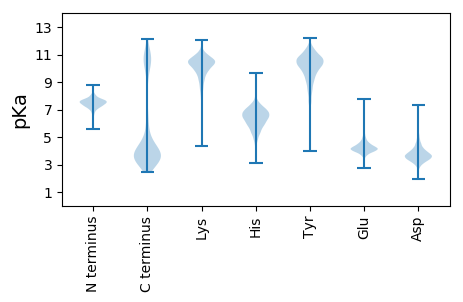
Summary statistics related to proteome-wise predictions


Protein with the lowest isoelectric point:
>tr|Q38VG6|Q38VG6_LACSS Putative priming glycosyl transferase OS=Lactobacillus sakei subsp. sakei (strain 23K) OX=314315 GN=LCA_1510_g PE=3 SV=1
MM1 pKa = 7.11ATAKK5 pKa = 10.11VVYY8 pKa = 10.71ASMTGNNEE16 pKa = 3.75EE17 pKa = 3.89IADD20 pKa = 3.77IVEE23 pKa = 4.14EE24 pKa = 4.05ALEE27 pKa = 4.11NLDD30 pKa = 3.57VSVEE34 pKa = 4.08TSEE37 pKa = 5.29ISQADD42 pKa = 3.48PSDD45 pKa = 4.64FEE47 pKa = 4.76DD48 pKa = 3.42TDD50 pKa = 3.42ICIVCSYY57 pKa = 10.64TYY59 pKa = 11.11GDD61 pKa = 5.25DD62 pKa = 4.25GDD64 pKa = 5.07LPDD67 pKa = 4.27EE68 pKa = 4.6AVDD71 pKa = 4.29FYY73 pKa = 11.82EE74 pKa = 5.25DD75 pKa = 3.89LKK77 pKa = 11.71EE78 pKa = 3.78MDD80 pKa = 4.04LTGKK84 pKa = 10.55VYY86 pKa = 9.98GVCGSGDD93 pKa = 3.21TFYY96 pKa = 11.46DD97 pKa = 3.86EE98 pKa = 4.35FCKK101 pKa = 10.99VVDD104 pKa = 4.09DD105 pKa = 4.13FAGVFEE111 pKa = 4.32QTGATKK117 pKa = 10.58GSDD120 pKa = 3.49VVKK123 pKa = 10.93VDD125 pKa = 4.52LAPEE129 pKa = 4.46AEE131 pKa = 4.85DD132 pKa = 3.99IEE134 pKa = 4.44HH135 pKa = 6.77LEE137 pKa = 4.11KK138 pKa = 10.67FVAEE142 pKa = 4.39IVAKK146 pKa = 10.61QSALL150 pKa = 3.48
MM1 pKa = 7.11ATAKK5 pKa = 10.11VVYY8 pKa = 10.71ASMTGNNEE16 pKa = 3.75EE17 pKa = 3.89IADD20 pKa = 3.77IVEE23 pKa = 4.14EE24 pKa = 4.05ALEE27 pKa = 4.11NLDD30 pKa = 3.57VSVEE34 pKa = 4.08TSEE37 pKa = 5.29ISQADD42 pKa = 3.48PSDD45 pKa = 4.64FEE47 pKa = 4.76DD48 pKa = 3.42TDD50 pKa = 3.42ICIVCSYY57 pKa = 10.64TYY59 pKa = 11.11GDD61 pKa = 5.25DD62 pKa = 4.25GDD64 pKa = 5.07LPDD67 pKa = 4.27EE68 pKa = 4.6AVDD71 pKa = 4.29FYY73 pKa = 11.82EE74 pKa = 5.25DD75 pKa = 3.89LKK77 pKa = 11.71EE78 pKa = 3.78MDD80 pKa = 4.04LTGKK84 pKa = 10.55VYY86 pKa = 9.98GVCGSGDD93 pKa = 3.21TFYY96 pKa = 11.46DD97 pKa = 3.86EE98 pKa = 4.35FCKK101 pKa = 10.99VVDD104 pKa = 4.09DD105 pKa = 4.13FAGVFEE111 pKa = 4.32QTGATKK117 pKa = 10.58GSDD120 pKa = 3.49VVKK123 pKa = 10.93VDD125 pKa = 4.52LAPEE129 pKa = 4.46AEE131 pKa = 4.85DD132 pKa = 3.99IEE134 pKa = 4.44HH135 pKa = 6.77LEE137 pKa = 4.11KK138 pKa = 10.67FVAEE142 pKa = 4.39IVAKK146 pKa = 10.61QSALL150 pKa = 3.48
Molecular weight: 16.28 kDa
Isoelectric point according different methods:
Protein with the highest isoelectric point:
>tr|Q38UF6|Q38UF6_LACSS Uncharacterized protein OS=Lactobacillus sakei subsp. sakei (strain 23K) OX=314315 GN=LCA_1873 PE=4 SV=1
MM1 pKa = 5.72TTKK4 pKa = 9.85RR5 pKa = 11.84TFQPKK10 pKa = 9.03KK11 pKa = 7.46RR12 pKa = 11.84HH13 pKa = 5.51KK14 pKa = 9.79EE15 pKa = 3.74RR16 pKa = 11.84VHH18 pKa = 8.0GFMKK22 pKa = 10.62RR23 pKa = 11.84MNTKK27 pKa = 10.02NGRR30 pKa = 11.84KK31 pKa = 8.78VLARR35 pKa = 11.84RR36 pKa = 11.84RR37 pKa = 11.84AKK39 pKa = 9.94GRR41 pKa = 11.84KK42 pKa = 8.67VLSAA46 pKa = 4.05
MM1 pKa = 5.72TTKK4 pKa = 9.85RR5 pKa = 11.84TFQPKK10 pKa = 9.03KK11 pKa = 7.46RR12 pKa = 11.84HH13 pKa = 5.51KK14 pKa = 9.79EE15 pKa = 3.74RR16 pKa = 11.84VHH18 pKa = 8.0GFMKK22 pKa = 10.62RR23 pKa = 11.84MNTKK27 pKa = 10.02NGRR30 pKa = 11.84KK31 pKa = 8.78VLARR35 pKa = 11.84RR36 pKa = 11.84RR37 pKa = 11.84AKK39 pKa = 9.94GRR41 pKa = 11.84KK42 pKa = 8.67VLSAA46 pKa = 4.05
Molecular weight: 5.52 kDa
Isoelectric point according different methods:
Peptides (in silico digests for buttom-up proteomics)
Below you can find in silico digests of the whole proteome with Trypsin, Chymotrypsin, Trypsin+LysC, LysN, ArgC proteases suitable for different mass spec machines.| Try ESI |
 |
|---|
| ChTry ESI |
 |
|---|
| ArgC ESI |
 |
|---|
| LysN ESI |
 |
|---|
| TryLysC ESI |
 |
|---|
| Try MALDI |
 |
|---|
| ChTry MALDI |
 |
|---|
| ArgC MALDI |
 |
|---|
| LysN MALDI |
 |
|---|
| TryLysC MALDI |
 |
|---|
| Try LTQ |
 |
|---|
| ChTry LTQ |
 |
|---|
| ArgC LTQ |
 |
|---|
| LysN LTQ |
 |
|---|
| TryLysC LTQ |
 |
|---|
| Try MSlow |
 |
|---|
| ChTry MSlow |
 |
|---|
| ArgC MSlow |
 |
|---|
| LysN MSlow |
 |
|---|
| TryLysC MSlow |
 |
|---|
| Try MShigh |
 |
|---|
| ChTry MShigh |
 |
|---|
| ArgC MShigh |
 |
|---|
| LysN MShigh |
 |
|---|
| TryLysC MShigh |
 |
|---|
General Statistics
Number of major isoforms |
Number of additional isoforms |
Number of all proteins |
Number of amino acids |
Min. Seq. Length |
Max. Seq. Length |
Avg. Seq. Length |
Avg. Mol. Weight |
|---|---|---|---|---|---|---|---|
0 |
542104 |
8 |
1987 |
289.6 |
32.19 |
Amino acid frequency
Ala |
Cys |
Asp |
Glu |
Phe |
Gly |
His |
Ile |
Lys |
Leu |
|---|---|---|---|---|---|---|---|---|---|
8.783 ± 0.064 | 0.487 ± 0.014 |
5.439 ± 0.056 | 5.554 ± 0.068 |
4.119 ± 0.039 | 6.625 ± 0.055 |
2.011 ± 0.026 | 7.179 ± 0.053 |
5.867 ± 0.047 | 10.201 ± 0.075 |
Met |
Asn |
Gln |
Pro |
Arg |
Ser |
Thr |
Val |
Trp |
Tyr |
|---|---|---|---|---|---|---|---|---|---|
2.754 ± 0.029 | 4.35 ± 0.045 |
3.739 ± 0.03 | 5.478 ± 0.059 |
3.915 ± 0.047 | 5.415 ± 0.048 |
6.595 ± 0.063 | 7.103 ± 0.05 |
0.975 ± 0.021 | 3.412 ± 0.035 |
Most of the basic statistics you can see at this page can be downloaded from this CSV file
Proteome-pI is available under Creative Commons Attribution-NoDerivs license, for more details see here
| Reference: Kozlowski LP. Proteome-pI 2.0: Proteome Isoelectric Point Database Update. Nucleic Acids Res. 2021, doi: 10.1093/nar/gkab944 | Contact: Lukasz P. Kozlowski |
