Pontibacter diazotrophicus
Taxonomy: cellular organisms; Bacteria; FCB group; Bacteroidetes/Chlorobi group; Bacteroidetes; Cytophagia; Cytophagales; Hymenobacteraceae; Pontibacter
Average proteome isoelectric point is 6.27
Get precalculated fractions of proteins

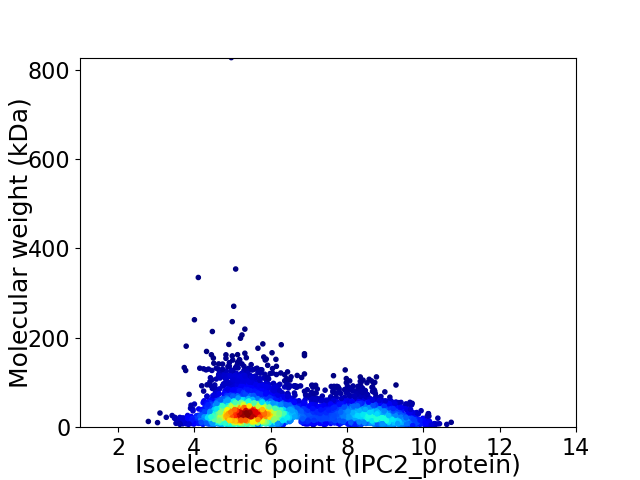
Virtual 2D-PAGE plot for 5237 proteins (isoelectric point calculated using IPC2_protein)
Get csv file with sequences according to given criteria:
* You can choose from 21 different methods for calculating isoelectric point
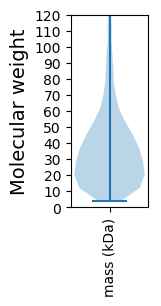
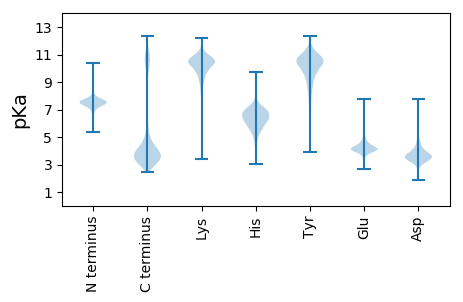
Summary statistics related to proteome-wise predictions


Protein with the lowest isoelectric point:
>tr|A0A3D8LER3|A0A3D8LER3_9BACT GntP family permease OS=Pontibacter diazotrophicus OX=1400979 GN=DXT99_06925 PE=4 SV=1
MM1 pKa = 7.59KK2 pKa = 10.35KK3 pKa = 10.58GEE5 pKa = 4.17RR6 pKa = 11.84NSLRR10 pKa = 11.84MIRR13 pKa = 11.84SILSLFFMAGVAACNGEE30 pKa = 4.35TEE32 pKa = 4.43VVEE35 pKa = 4.28QEE37 pKa = 4.4VVTDD41 pKa = 4.17DD42 pKa = 3.69VAVAEE47 pKa = 4.4TWDD50 pKa = 3.42EE51 pKa = 4.06EE52 pKa = 4.47EE53 pKa = 5.16YY54 pKa = 9.84YY55 pKa = 8.17TTFGTTTYY63 pKa = 11.05YY64 pKa = 10.77EE65 pKa = 4.24DD66 pKa = 3.4WDD68 pKa = 3.67IDD70 pKa = 3.86EE71 pKa = 6.0DD72 pKa = 4.02SLLNEE77 pKa = 4.52EE78 pKa = 4.67EE79 pKa = 4.43FTASFYY85 pKa = 10.8QIWDD89 pKa = 3.65LNNDD93 pKa = 2.98GRR95 pKa = 11.84ISQGEE100 pKa = 4.21WTTVVSDD107 pKa = 3.45YY108 pKa = 11.73GNGIDD113 pKa = 5.04AADD116 pKa = 3.75WQPWDD121 pKa = 3.52TDD123 pKa = 2.95GDD125 pKa = 4.19GFIEE129 pKa = 3.97RR130 pKa = 11.84VEE132 pKa = 3.99FDD134 pKa = 3.24GDD136 pKa = 3.58FAEE139 pKa = 4.82LGWYY143 pKa = 7.47NTWDD147 pKa = 3.58TDD149 pKa = 3.79GDD151 pKa = 4.02GQLTEE156 pKa = 4.4RR157 pKa = 11.84EE158 pKa = 4.52YY159 pKa = 10.16ITGTFTLWDD168 pKa = 3.76TNGDD172 pKa = 3.76NVLDD176 pKa = 3.63TAEE179 pKa = 4.06YY180 pKa = 10.14RR181 pKa = 11.84RR182 pKa = 11.84HH183 pKa = 3.56QTYY186 pKa = 10.42YY187 pKa = 11.31SNN189 pKa = 3.83
MM1 pKa = 7.59KK2 pKa = 10.35KK3 pKa = 10.58GEE5 pKa = 4.17RR6 pKa = 11.84NSLRR10 pKa = 11.84MIRR13 pKa = 11.84SILSLFFMAGVAACNGEE30 pKa = 4.35TEE32 pKa = 4.43VVEE35 pKa = 4.28QEE37 pKa = 4.4VVTDD41 pKa = 4.17DD42 pKa = 3.69VAVAEE47 pKa = 4.4TWDD50 pKa = 3.42EE51 pKa = 4.06EE52 pKa = 4.47EE53 pKa = 5.16YY54 pKa = 9.84YY55 pKa = 8.17TTFGTTTYY63 pKa = 11.05YY64 pKa = 10.77EE65 pKa = 4.24DD66 pKa = 3.4WDD68 pKa = 3.67IDD70 pKa = 3.86EE71 pKa = 6.0DD72 pKa = 4.02SLLNEE77 pKa = 4.52EE78 pKa = 4.67EE79 pKa = 4.43FTASFYY85 pKa = 10.8QIWDD89 pKa = 3.65LNNDD93 pKa = 2.98GRR95 pKa = 11.84ISQGEE100 pKa = 4.21WTTVVSDD107 pKa = 3.45YY108 pKa = 11.73GNGIDD113 pKa = 5.04AADD116 pKa = 3.75WQPWDD121 pKa = 3.52TDD123 pKa = 2.95GDD125 pKa = 4.19GFIEE129 pKa = 3.97RR130 pKa = 11.84VEE132 pKa = 3.99FDD134 pKa = 3.24GDD136 pKa = 3.58FAEE139 pKa = 4.82LGWYY143 pKa = 7.47NTWDD147 pKa = 3.58TDD149 pKa = 3.79GDD151 pKa = 4.02GQLTEE156 pKa = 4.4RR157 pKa = 11.84EE158 pKa = 4.52YY159 pKa = 10.16ITGTFTLWDD168 pKa = 3.76TNGDD172 pKa = 3.76NVLDD176 pKa = 3.63TAEE179 pKa = 4.06YY180 pKa = 10.14RR181 pKa = 11.84RR182 pKa = 11.84HH183 pKa = 3.56QTYY186 pKa = 10.42YY187 pKa = 11.31SNN189 pKa = 3.83
Molecular weight: 21.89 kDa
Isoelectric point according different methods:
Protein with the highest isoelectric point:
>tr|A0A3D8L1I2|A0A3D8L1I2_9BACT Uncharacterized protein OS=Pontibacter diazotrophicus OX=1400979 GN=DXT99_25395 PE=4 SV=1
MM1 pKa = 7.69FGRR4 pKa = 11.84INNKK8 pKa = 8.23VPKK11 pKa = 9.71INQQINPSASTEE23 pKa = 4.0SRR25 pKa = 11.84LLARR29 pKa = 11.84GFAKK33 pKa = 9.68MCLLTHH39 pKa = 6.82GSLPLMQHH47 pKa = 5.41YY48 pKa = 9.92VRR50 pKa = 11.84SFRR53 pKa = 11.84TPVLKK58 pKa = 10.24SVRR61 pKa = 11.84QFRR64 pKa = 11.84CLQARR69 pKa = 11.84FLHH72 pKa = 6.61CIPHH76 pKa = 6.44GKK78 pKa = 8.0PACGLLIGFTNLPIRR93 pKa = 11.84DD94 pKa = 3.92MHH96 pKa = 6.75PLDD99 pKa = 3.98NLSIFLLKK107 pKa = 10.86YY108 pKa = 8.66NSCHH112 pKa = 6.86AGHH115 pKa = 6.19TQSAA119 pKa = 3.72
MM1 pKa = 7.69FGRR4 pKa = 11.84INNKK8 pKa = 8.23VPKK11 pKa = 9.71INQQINPSASTEE23 pKa = 4.0SRR25 pKa = 11.84LLARR29 pKa = 11.84GFAKK33 pKa = 9.68MCLLTHH39 pKa = 6.82GSLPLMQHH47 pKa = 5.41YY48 pKa = 9.92VRR50 pKa = 11.84SFRR53 pKa = 11.84TPVLKK58 pKa = 10.24SVRR61 pKa = 11.84QFRR64 pKa = 11.84CLQARR69 pKa = 11.84FLHH72 pKa = 6.61CIPHH76 pKa = 6.44GKK78 pKa = 8.0PACGLLIGFTNLPIRR93 pKa = 11.84DD94 pKa = 3.92MHH96 pKa = 6.75PLDD99 pKa = 3.98NLSIFLLKK107 pKa = 10.86YY108 pKa = 8.66NSCHH112 pKa = 6.86AGHH115 pKa = 6.19TQSAA119 pKa = 3.72
Molecular weight: 13.44 kDa
Isoelectric point according different methods:
Peptides (in silico digests for buttom-up proteomics)
Below you can find in silico digests of the whole proteome with Trypsin, Chymotrypsin, Trypsin+LysC, LysN, ArgC proteases suitable for different mass spec machines.| Try ESI |
 |
|---|
| ChTry ESI |
 |
|---|
| ArgC ESI |
 |
|---|
| LysN ESI |
 |
|---|
| TryLysC ESI |
 |
|---|
| Try MALDI |
 |
|---|
| ChTry MALDI |
 |
|---|
| ArgC MALDI |
 |
|---|
| LysN MALDI |
 |
|---|
| TryLysC MALDI |
 |
|---|
| Try LTQ |
 |
|---|
| ChTry LTQ |
 |
|---|
| ArgC LTQ |
 |
|---|
| LysN LTQ |
 |
|---|
| TryLysC LTQ |
 |
|---|
| Try MSlow |
 |
|---|
| ChTry MSlow |
 |
|---|
| ArgC MSlow |
 |
|---|
| LysN MSlow |
 |
|---|
| TryLysC MSlow |
 |
|---|
| Try MShigh |
 |
|---|
| ChTry MShigh |
 |
|---|
| ArgC MShigh |
 |
|---|
| LysN MShigh |
 |
|---|
| TryLysC MShigh |
 |
|---|
General Statistics
Number of major isoforms |
Number of additional isoforms |
Number of all proteins |
Number of amino acids |
Min. Seq. Length |
Max. Seq. Length |
Avg. Seq. Length |
Avg. Mol. Weight |
|---|---|---|---|---|---|---|---|
0 |
1775216 |
32 |
7403 |
339.0 |
37.95 |
Amino acid frequency
Ala |
Cys |
Asp |
Glu |
Phe |
Gly |
His |
Ile |
Lys |
Leu |
|---|---|---|---|---|---|---|---|---|---|
8.067 ± 0.035 | 0.73 ± 0.011 |
5.19 ± 0.028 | 6.7 ± 0.033 |
4.529 ± 0.023 | 7.03 ± 0.037 |
2.036 ± 0.018 | 6.001 ± 0.031 |
5.736 ± 0.037 | 9.879 ± 0.046 |
Met |
Asn |
Gln |
Pro |
Arg |
Ser |
Thr |
Val |
Trp |
Tyr |
|---|---|---|---|---|---|---|---|---|---|
2.407 ± 0.018 | 4.752 ± 0.029 |
4.161 ± 0.017 | 4.268 ± 0.028 |
4.674 ± 0.022 | 6.056 ± 0.025 |
5.668 ± 0.034 | 6.934 ± 0.029 |
1.193 ± 0.014 | 3.986 ± 0.025 |
Most of the basic statistics you can see at this page can be downloaded from this CSV file
Proteome-pI is available under Creative Commons Attribution-NoDerivs license, for more details see here
| Reference: Kozlowski LP. Proteome-pI 2.0: Proteome Isoelectric Point Database Update. Nucleic Acids Res. 2021, doi: 10.1093/nar/gkab944 | Contact: Lukasz P. Kozlowski |
