Chryseobacterium piperi
Taxonomy: cellular organisms; Bacteria; FCB group; Bacteroidetes/Chlorobi group; Bacteroidetes; Flavobacteriia; Flavobacteriales; Weeksellaceae; Chryseobacterium group;
Average proteome isoelectric point is 6.69
Get precalculated fractions of proteins

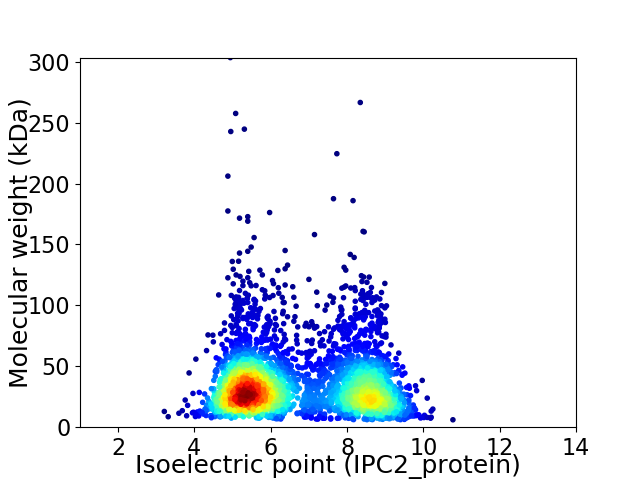
Virtual 2D-PAGE plot for 3502 proteins (isoelectric point calculated using IPC2_protein)
Get csv file with sequences according to given criteria:
* You can choose from 21 different methods for calculating isoelectric point
Summary statistics related to proteome-wise predictions


Protein with the lowest isoelectric point:
>tr|A0A086BAY3|A0A086BAY3_9FLAO Hydroxyacid dehydrogenase OS=Chryseobacterium piperi OX=558152 GN=IQ37_11675 PE=3 SV=1
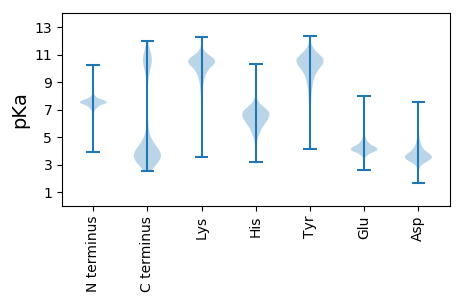
MM1 pKa = 7.78KK2 pKa = 9.23NTLLLKK8 pKa = 9.68TIILTLVLSSYY19 pKa = 11.88SMVKK23 pKa = 10.11AQYY26 pKa = 10.66DD27 pKa = 3.84PNQDD31 pKa = 3.28LDD33 pKa = 3.72GDD35 pKa = 4.6GIINSIDD42 pKa = 4.16LDD44 pKa = 4.37DD45 pKa = 6.14DD46 pKa = 4.09NDD48 pKa = 5.11GIPDD52 pKa = 4.01LLEE55 pKa = 4.5SPPSNTVVNGTFTGTSAPWVLGTGWVFNSGGGNVRR90 pKa = 11.84IEE92 pKa = 4.1TDD94 pKa = 3.17NVSNRR99 pKa = 11.84DD100 pKa = 3.17LRR102 pKa = 11.84QTVNNLNRR110 pKa = 11.84TNGTIALTMRR120 pKa = 11.84LGAQDD125 pKa = 3.72GSNAAGSTASLQVILNGTVYY145 pKa = 10.0ATINNGTTRR154 pKa = 11.84STATNNITITLANGATSNFTPYY176 pKa = 7.72TTAVATGYY184 pKa = 8.34TFQTFTINIPYY195 pKa = 9.63NSPGTADD202 pKa = 4.73LIFRR206 pKa = 11.84ATTVLDD212 pKa = 3.91DD213 pKa = 3.48WTLDD217 pKa = 4.26DD218 pKa = 3.69IAIPAFIEE226 pKa = 4.31DD227 pKa = 4.05TDD229 pKa = 4.32GDD231 pKa = 4.69GIPNYY236 pKa = 10.14QDD238 pKa = 4.45LDD240 pKa = 3.95SDD242 pKa = 4.51NDD244 pKa = 3.81GCLDD248 pKa = 4.14AMEE251 pKa = 5.0GDD253 pKa = 4.02EE254 pKa = 4.06NVAYY258 pKa = 10.97SMLVAAAPGLTVGTGSTAPNQNLCSTGACVDD289 pKa = 3.57AQGVPVVVNAGGAADD304 pKa = 3.7IGSDD308 pKa = 3.23QGQGIGDD315 pKa = 3.9SKK317 pKa = 11.49NNAVIACYY325 pKa = 9.89CYY327 pKa = 10.66KK328 pKa = 10.49PVVTAGTALNTPYY341 pKa = 10.94GITALGRR348 pKa = 11.84AGANSGNWPMVRR360 pKa = 11.84KK361 pKa = 9.28GAWTALEE368 pKa = 4.33AKK370 pKa = 9.6TKK372 pKa = 10.55GFVPNRR378 pKa = 11.84LTSTQISAIPAANLVEE394 pKa = 4.66GMMVYY399 pKa = 8.62NTTLDD404 pKa = 3.75CLQVNTNGTASGWACFNTQTCPTNN428 pKa = 3.32
MM1 pKa = 7.78KK2 pKa = 9.23NTLLLKK8 pKa = 9.68TIILTLVLSSYY19 pKa = 11.88SMVKK23 pKa = 10.11AQYY26 pKa = 10.66DD27 pKa = 3.84PNQDD31 pKa = 3.28LDD33 pKa = 3.72GDD35 pKa = 4.6GIINSIDD42 pKa = 4.16LDD44 pKa = 4.37DD45 pKa = 6.14DD46 pKa = 4.09NDD48 pKa = 5.11GIPDD52 pKa = 4.01LLEE55 pKa = 4.5SPPSNTVVNGTFTGTSAPWVLGTGWVFNSGGGNVRR90 pKa = 11.84IEE92 pKa = 4.1TDD94 pKa = 3.17NVSNRR99 pKa = 11.84DD100 pKa = 3.17LRR102 pKa = 11.84QTVNNLNRR110 pKa = 11.84TNGTIALTMRR120 pKa = 11.84LGAQDD125 pKa = 3.72GSNAAGSTASLQVILNGTVYY145 pKa = 10.0ATINNGTTRR154 pKa = 11.84STATNNITITLANGATSNFTPYY176 pKa = 7.72TTAVATGYY184 pKa = 8.34TFQTFTINIPYY195 pKa = 9.63NSPGTADD202 pKa = 4.73LIFRR206 pKa = 11.84ATTVLDD212 pKa = 3.91DD213 pKa = 3.48WTLDD217 pKa = 4.26DD218 pKa = 3.69IAIPAFIEE226 pKa = 4.31DD227 pKa = 4.05TDD229 pKa = 4.32GDD231 pKa = 4.69GIPNYY236 pKa = 10.14QDD238 pKa = 4.45LDD240 pKa = 3.95SDD242 pKa = 4.51NDD244 pKa = 3.81GCLDD248 pKa = 4.14AMEE251 pKa = 5.0GDD253 pKa = 4.02EE254 pKa = 4.06NVAYY258 pKa = 10.97SMLVAAAPGLTVGTGSTAPNQNLCSTGACVDD289 pKa = 3.57AQGVPVVVNAGGAADD304 pKa = 3.7IGSDD308 pKa = 3.23QGQGIGDD315 pKa = 3.9SKK317 pKa = 11.49NNAVIACYY325 pKa = 9.89CYY327 pKa = 10.66KK328 pKa = 10.49PVVTAGTALNTPYY341 pKa = 10.94GITALGRR348 pKa = 11.84AGANSGNWPMVRR360 pKa = 11.84KK361 pKa = 9.28GAWTALEE368 pKa = 4.33AKK370 pKa = 9.6TKK372 pKa = 10.55GFVPNRR378 pKa = 11.84LTSTQISAIPAANLVEE394 pKa = 4.66GMMVYY399 pKa = 8.62NTTLDD404 pKa = 3.75CLQVNTNGTASGWACFNTQTCPTNN428 pKa = 3.32
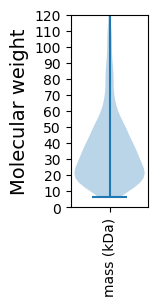
Molecular weight: 44.54 kDa
Isoelectric point according different methods:
Protein with the highest isoelectric point:
>tr|A0A086BLU0|A0A086BLU0_9FLAO Leucine--tRNA ligase OS=Chryseobacterium piperi OX=558152 GN=leuS PE=3 SV=1
MM1 pKa = 7.69SKK3 pKa = 9.0RR4 pKa = 11.84TFQPSEE10 pKa = 3.59RR11 pKa = 11.84KK12 pKa = 9.33RR13 pKa = 11.84RR14 pKa = 11.84NKK16 pKa = 10.03HH17 pKa = 3.97GFRR20 pKa = 11.84EE21 pKa = 4.33RR22 pKa = 11.84MSTPNGRR29 pKa = 11.84RR30 pKa = 11.84VLAARR35 pKa = 11.84RR36 pKa = 11.84AKK38 pKa = 10.01GRR40 pKa = 11.84KK41 pKa = 9.03SLTISAARR49 pKa = 11.84AKK51 pKa = 10.4RR52 pKa = 3.38
MM1 pKa = 7.69SKK3 pKa = 9.0RR4 pKa = 11.84TFQPSEE10 pKa = 3.59RR11 pKa = 11.84KK12 pKa = 9.33RR13 pKa = 11.84RR14 pKa = 11.84NKK16 pKa = 10.03HH17 pKa = 3.97GFRR20 pKa = 11.84EE21 pKa = 4.33RR22 pKa = 11.84MSTPNGRR29 pKa = 11.84RR30 pKa = 11.84VLAARR35 pKa = 11.84RR36 pKa = 11.84AKK38 pKa = 10.01GRR40 pKa = 11.84KK41 pKa = 9.03SLTISAARR49 pKa = 11.84AKK51 pKa = 10.4RR52 pKa = 3.38
Molecular weight: 6.1 kDa
Isoelectric point according different methods:
Peptides (in silico digests for buttom-up proteomics)
Below you can find in silico digests of the whole proteome with Trypsin, Chymotrypsin, Trypsin+LysC, LysN, ArgC proteases suitable for different mass spec machines.| Try ESI |
 |
|---|
| ChTry ESI |
 |
|---|
| ArgC ESI |
 |
|---|
| LysN ESI |
 |
|---|
| TryLysC ESI |
 |
|---|
| Try MALDI |
 |
|---|
| ChTry MALDI |
 |
|---|
| ArgC MALDI |
 |
|---|
| LysN MALDI |
 |
|---|
| TryLysC MALDI |
 |
|---|
| Try LTQ |
 |
|---|
| ChTry LTQ |
 |
|---|
| ArgC LTQ |
 |
|---|
| LysN LTQ |
 |
|---|
| TryLysC LTQ |
 |
|---|
| Try MSlow |
 |
|---|
| ChTry MSlow |
 |
|---|
| ArgC MSlow |
 |
|---|
| LysN MSlow |
 |
|---|
| TryLysC MSlow |
 |
|---|
| Try MShigh |
 |
|---|
| ChTry MShigh |
 |
|---|
| ArgC MShigh |
 |
|---|
| LysN MShigh |
 |
|---|
| TryLysC MShigh |
 |
|---|
General Statistics
Number of major isoforms |
Number of additional isoforms |
Number of all proteins |
Number of amino acids |
Min. Seq. Length |
Max. Seq. Length |
Avg. Seq. Length |
Avg. Mol. Weight |
|---|---|---|---|---|---|---|---|
0 |
1174652 |
51 |
2623 |
335.4 |
37.93 |
Amino acid frequency
Ala |
Cys |
Asp |
Glu |
Phe |
Gly |
His |
Ile |
Lys |
Leu |
|---|---|---|---|---|---|---|---|---|---|
6.152 ± 0.039 | 0.695 ± 0.012 |
5.358 ± 0.029 | 6.498 ± 0.054 |
5.315 ± 0.034 | 6.489 ± 0.039 |
1.724 ± 0.018 | 7.981 ± 0.04 |
8.086 ± 0.046 | 9.056 ± 0.04 |
Met |
Asn |
Gln |
Pro |
Arg |
Ser |
Thr |
Val |
Trp |
Tyr |
|---|---|---|---|---|---|---|---|---|---|
2.356 ± 0.019 | 6.315 ± 0.047 |
3.508 ± 0.022 | 3.619 ± 0.025 |
3.365 ± 0.027 | 6.601 ± 0.032 |
5.563 ± 0.036 | 6.002 ± 0.029 |
1.082 ± 0.015 | 4.236 ± 0.03 |
Most of the basic statistics you can see at this page can be downloaded from this CSV file
Proteome-pI is available under Creative Commons Attribution-NoDerivs license, for more details see here
| Reference: Kozlowski LP. Proteome-pI 2.0: Proteome Isoelectric Point Database Update. Nucleic Acids Res. 2021, doi: 10.1093/nar/gkab944 | Contact: Lukasz P. Kozlowski |
