Rhodococcus jostii (strain RHA1)
Taxonomy: cellular organisms; Bacteria; Terrabacteria group; Actinobacteria; Actinomycetia; Corynebacteriales; Nocardiaceae; Rhodococcus; Rhodococcus jostii
Average proteome isoelectric point is 6.17
Get precalculated fractions of proteins

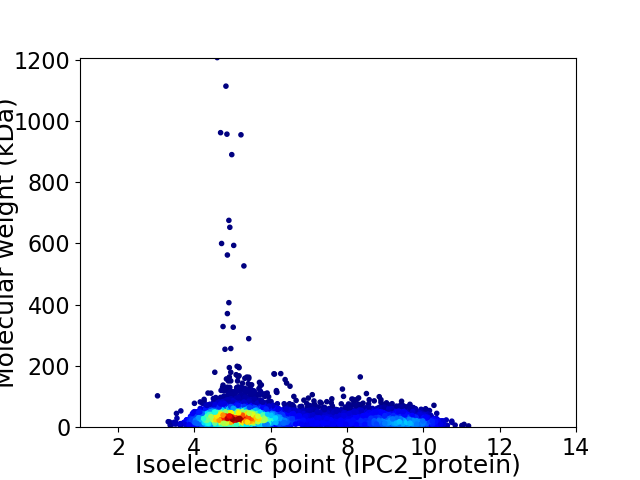
Virtual 2D-PAGE plot for 9075 proteins (isoelectric point calculated using IPC2_protein)
Get csv file with sequences according to given criteria:
* You can choose from 21 different methods for calculating isoelectric point
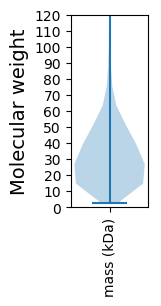
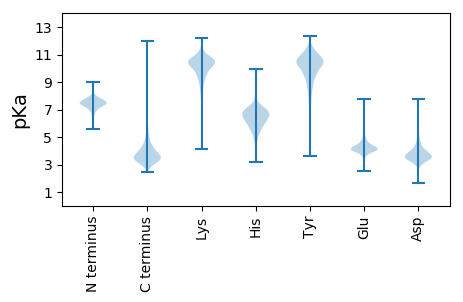
Summary statistics related to proteome-wise predictions


Protein with the lowest isoelectric point:
>tr|Q0S6K0|Q0S6K0_RHOJR Uncharacterized protein OS=Rhodococcus jostii (strain RHA1) OX=101510 GN=RHA1_ro05055 PE=4 SV=1
MM1 pKa = 8.23RR2 pKa = 11.84DD3 pKa = 2.8TAIAVDD9 pKa = 4.45TIGVATVISEE19 pKa = 3.76EE20 pKa = 4.14RR21 pKa = 11.84VADD24 pKa = 3.57GHH26 pKa = 5.59LTEE29 pKa = 5.33GSDD32 pKa = 3.21MTGLVRR38 pKa = 11.84RR39 pKa = 11.84VCTAVVALSATAVLVAGCGSDD60 pKa = 3.43TTPTAVPEE68 pKa = 4.48SGASAATTSSEE79 pKa = 4.01STTVIDD85 pKa = 4.1GQEE88 pKa = 4.22GEE90 pKa = 4.47DD91 pKa = 3.6AGGDD95 pKa = 3.27VDD97 pKa = 5.34FEE99 pKa = 4.51VAIGEE104 pKa = 4.42CVKK107 pKa = 11.09LGGTVSDD114 pKa = 4.22AEE116 pKa = 4.07IDD118 pKa = 3.71KK119 pKa = 10.7AVCGSADD126 pKa = 3.31SNYY129 pKa = 10.61KK130 pKa = 10.45VIAKK134 pKa = 9.33AAKK137 pKa = 9.55NSQCISDD144 pKa = 3.84ADD146 pKa = 3.64SYY148 pKa = 11.75YY149 pKa = 10.63YY150 pKa = 8.66EE151 pKa = 4.14TLGGIEE157 pKa = 4.08QGAICLDD164 pKa = 3.75VDD166 pKa = 3.83WVIGGCMDD174 pKa = 4.44VGGEE178 pKa = 3.92DD179 pKa = 4.28PARR182 pKa = 11.84IDD184 pKa = 4.56CGDD187 pKa = 3.41TTAVDD192 pKa = 4.14GVKK195 pKa = 9.01VTEE198 pKa = 4.22IVQGATSVDD207 pKa = 3.6SCSTSSNGYY216 pKa = 9.2EE217 pKa = 3.83YY218 pKa = 10.24PEE220 pKa = 4.15RR221 pKa = 11.84KK222 pKa = 9.12FVVCVDD228 pKa = 3.62EE229 pKa = 4.47LL230 pKa = 3.79
MM1 pKa = 8.23RR2 pKa = 11.84DD3 pKa = 2.8TAIAVDD9 pKa = 4.45TIGVATVISEE19 pKa = 3.76EE20 pKa = 4.14RR21 pKa = 11.84VADD24 pKa = 3.57GHH26 pKa = 5.59LTEE29 pKa = 5.33GSDD32 pKa = 3.21MTGLVRR38 pKa = 11.84RR39 pKa = 11.84VCTAVVALSATAVLVAGCGSDD60 pKa = 3.43TTPTAVPEE68 pKa = 4.48SGASAATTSSEE79 pKa = 4.01STTVIDD85 pKa = 4.1GQEE88 pKa = 4.22GEE90 pKa = 4.47DD91 pKa = 3.6AGGDD95 pKa = 3.27VDD97 pKa = 5.34FEE99 pKa = 4.51VAIGEE104 pKa = 4.42CVKK107 pKa = 11.09LGGTVSDD114 pKa = 4.22AEE116 pKa = 4.07IDD118 pKa = 3.71KK119 pKa = 10.7AVCGSADD126 pKa = 3.31SNYY129 pKa = 10.61KK130 pKa = 10.45VIAKK134 pKa = 9.33AAKK137 pKa = 9.55NSQCISDD144 pKa = 3.84ADD146 pKa = 3.64SYY148 pKa = 11.75YY149 pKa = 10.63YY150 pKa = 8.66EE151 pKa = 4.14TLGGIEE157 pKa = 4.08QGAICLDD164 pKa = 3.75VDD166 pKa = 3.83WVIGGCMDD174 pKa = 4.44VGGEE178 pKa = 3.92DD179 pKa = 4.28PARR182 pKa = 11.84IDD184 pKa = 4.56CGDD187 pKa = 3.41TTAVDD192 pKa = 4.14GVKK195 pKa = 9.01VTEE198 pKa = 4.22IVQGATSVDD207 pKa = 3.6SCSTSSNGYY216 pKa = 9.2EE217 pKa = 3.83YY218 pKa = 10.24PEE220 pKa = 4.15RR221 pKa = 11.84KK222 pKa = 9.12FVVCVDD228 pKa = 3.62EE229 pKa = 4.47LL230 pKa = 3.79
Molecular weight: 23.41 kDa
Isoelectric point according different methods:
Protein with the highest isoelectric point:
>tr|Q0SFB2|Q0SFB2_RHOJR Possible membrane protein OS=Rhodococcus jostii (strain RHA1) OX=101510 GN=RHA1_ro01963 PE=4 SV=1
MM1 pKa = 7.4GSVIKK6 pKa = 10.38KK7 pKa = 8.42RR8 pKa = 11.84RR9 pKa = 11.84KK10 pKa = 9.06RR11 pKa = 11.84MSKK14 pKa = 9.76KK15 pKa = 9.54KK16 pKa = 9.72HH17 pKa = 5.63RR18 pKa = 11.84KK19 pKa = 7.56LLRR22 pKa = 11.84RR23 pKa = 11.84TRR25 pKa = 11.84VQRR28 pKa = 11.84RR29 pKa = 11.84KK30 pKa = 10.11LGKK33 pKa = 9.87
MM1 pKa = 7.4GSVIKK6 pKa = 10.38KK7 pKa = 8.42RR8 pKa = 11.84RR9 pKa = 11.84KK10 pKa = 9.06RR11 pKa = 11.84MSKK14 pKa = 9.76KK15 pKa = 9.54KK16 pKa = 9.72HH17 pKa = 5.63RR18 pKa = 11.84KK19 pKa = 7.56LLRR22 pKa = 11.84RR23 pKa = 11.84TRR25 pKa = 11.84VQRR28 pKa = 11.84RR29 pKa = 11.84KK30 pKa = 10.11LGKK33 pKa = 9.87
Molecular weight: 4.15 kDa
Isoelectric point according different methods:
Peptides (in silico digests for buttom-up proteomics)
Below you can find in silico digests of the whole proteome with Trypsin, Chymotrypsin, Trypsin+LysC, LysN, ArgC proteases suitable for different mass spec machines.| Try ESI |
 |
|---|
| ChTry ESI |
 |
|---|
| ArgC ESI |
 |
|---|
| LysN ESI |
 |
|---|
| TryLysC ESI |
 |
|---|
| Try MALDI |
 |
|---|
| ChTry MALDI |
 |
|---|
| ArgC MALDI |
 |
|---|
| LysN MALDI |
 |
|---|
| TryLysC MALDI |
 |
|---|
| Try LTQ |
 |
|---|
| ChTry LTQ |
 |
|---|
| ArgC LTQ |
 |
|---|
| LysN LTQ |
 |
|---|
| TryLysC LTQ |
 |
|---|
| Try MSlow |
 |
|---|
| ChTry MSlow |
 |
|---|
| ArgC MSlow |
 |
|---|
| LysN MSlow |
 |
|---|
| TryLysC MSlow |
 |
|---|
| Try MShigh |
 |
|---|
| ChTry MShigh |
 |
|---|
| ArgC MShigh |
 |
|---|
| LysN MShigh |
 |
|---|
| TryLysC MShigh |
 |
|---|
General Statistics
Number of major isoforms |
Number of additional isoforms |
Number of all proteins |
Number of amino acids |
Min. Seq. Length |
Max. Seq. Length |
Avg. Seq. Length |
Avg. Mol. Weight |
|---|---|---|---|---|---|---|---|
0 |
2871138 |
24 |
11258 |
316.4 |
33.99 |
Amino acid frequency
Ala |
Cys |
Asp |
Glu |
Phe |
Gly |
His |
Ile |
Lys |
Leu |
|---|---|---|---|---|---|---|---|---|---|
12.473 ± 0.035 | 0.867 ± 0.009 |
6.266 ± 0.024 | 5.464 ± 0.025 |
3.024 ± 0.016 | 8.903 ± 0.028 |
2.348 ± 0.014 | 4.181 ± 0.021 |
2.083 ± 0.022 | 9.779 ± 0.029 |
Met |
Asn |
Gln |
Pro |
Arg |
Ser |
Thr |
Val |
Trp |
Tyr |
|---|---|---|---|---|---|---|---|---|---|
1.919 ± 0.012 | 2.072 ± 0.014 |
5.766 ± 0.021 | 2.812 ± 0.013 |
7.579 ± 0.032 | 5.827 ± 0.016 |
6.392 ± 0.021 | 8.785 ± 0.031 |
1.442 ± 0.011 | 2.019 ± 0.012 |
Most of the basic statistics you can see at this page can be downloaded from this CSV file
Proteome-pI is available under Creative Commons Attribution-NoDerivs license, for more details see here
| Reference: Kozlowski LP. Proteome-pI 2.0: Proteome Isoelectric Point Database Update. Nucleic Acids Res. 2021, doi: 10.1093/nar/gkab944 | Contact: Lukasz P. Kozlowski |
