Hankyongella ginsenosidimutans
Taxonomy: cellular organisms; Bacteria; Proteobacteria; Alphaproteobacteria; Sphingomonadales; Sphingomonadaceae; Hankyongella
Average proteome isoelectric point is 7.22
Get precalculated fractions of proteins

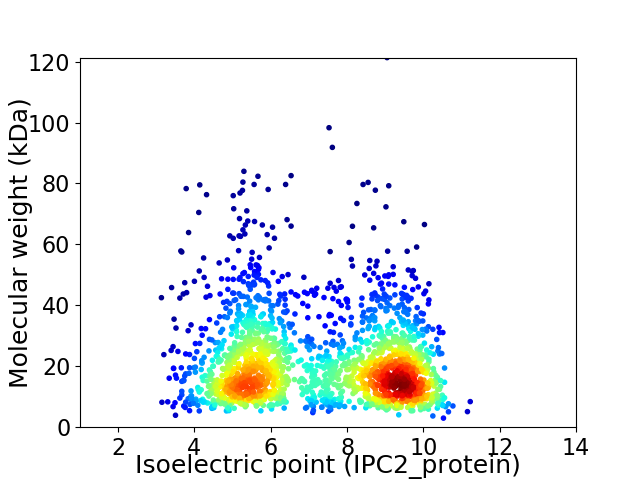
Virtual 2D-PAGE plot for 1977 proteins (isoelectric point calculated using IPC2_protein)
Get csv file with sequences according to given criteria:
* You can choose from 21 different methods for calculating isoelectric point
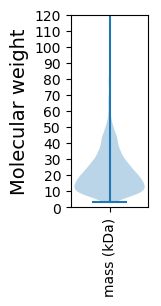
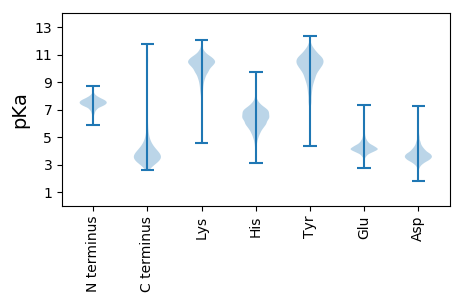
Summary statistics related to proteome-wise predictions


Protein with the lowest isoelectric point:
>tr|A0A4D7C9E4|A0A4D7C9E4_9SPHN Uncharacterized protein OS=Hankyongella ginsenosidimutans OX=1763828 GN=E6W36_08015 PE=4 SV=1
MM1 pKa = 7.81ANGLSSAVSTLTFTLQDD18 pKa = 2.9TDD20 pKa = 3.36EE21 pKa = 4.59RR22 pKa = 11.84LNPVIASTPVPVAEE36 pKa = 4.38NTTGTTIAALSGGSDD51 pKa = 3.71PDD53 pKa = 4.0GDD55 pKa = 4.04PQEE58 pKa = 3.84IDD60 pKa = 3.43YY61 pKa = 10.81FFVTGYY67 pKa = 11.1DD68 pKa = 3.12PGGLLRR74 pKa = 11.84IDD76 pKa = 3.62QTATGANLVVATAFDD91 pKa = 4.19YY92 pKa = 11.26EE93 pKa = 4.76SASQLYY99 pKa = 9.3PGQFYY104 pKa = 9.12YY105 pKa = 10.85TDD107 pKa = 3.09AGGRR111 pKa = 11.84YY112 pKa = 8.89VEE114 pKa = 4.28AKK116 pKa = 10.11VLAVQATNSNGFGSDD131 pKa = 3.32ADD133 pKa = 3.47NSTVNRR139 pKa = 11.84SPATTIKK146 pKa = 10.81VYY148 pKa = 8.99VTNADD153 pKa = 4.01DD154 pKa = 5.05APGAPSAQNINVSEE168 pKa = 4.12NVTGVIATLSGGIDD182 pKa = 3.38QDD184 pKa = 3.35GDD186 pKa = 3.82AISYY190 pKa = 8.44VFSNGSTTYY199 pKa = 10.91GDD201 pKa = 3.62YY202 pKa = 10.77TISEE206 pKa = 4.69DD207 pKa = 3.68YY208 pKa = 10.52KK209 pKa = 11.33LSITRR214 pKa = 11.84AFDD217 pKa = 3.87YY218 pKa = 10.98EE219 pKa = 4.41SLPANNKK226 pKa = 6.4STSVAVYY233 pKa = 10.09SKK235 pKa = 11.68ANGKK239 pKa = 9.53ISANSANITLNITNANDD256 pKa = 3.25APYY259 pKa = 10.86VYY261 pKa = 9.03MGPSTISIKK270 pKa = 10.76EE271 pKa = 4.0NIPINTVIAEE281 pKa = 3.95FTINDD286 pKa = 3.61QDD288 pKa = 3.67NDD290 pKa = 4.1NITTTLGTSVLNNLLGLKK308 pKa = 9.34PKK310 pKa = 10.19AAIRR314 pKa = 11.84IFINCTT320 pKa = 3.01
MM1 pKa = 7.81ANGLSSAVSTLTFTLQDD18 pKa = 2.9TDD20 pKa = 3.36EE21 pKa = 4.59RR22 pKa = 11.84LNPVIASTPVPVAEE36 pKa = 4.38NTTGTTIAALSGGSDD51 pKa = 3.71PDD53 pKa = 4.0GDD55 pKa = 4.04PQEE58 pKa = 3.84IDD60 pKa = 3.43YY61 pKa = 10.81FFVTGYY67 pKa = 11.1DD68 pKa = 3.12PGGLLRR74 pKa = 11.84IDD76 pKa = 3.62QTATGANLVVATAFDD91 pKa = 4.19YY92 pKa = 11.26EE93 pKa = 4.76SASQLYY99 pKa = 9.3PGQFYY104 pKa = 9.12YY105 pKa = 10.85TDD107 pKa = 3.09AGGRR111 pKa = 11.84YY112 pKa = 8.89VEE114 pKa = 4.28AKK116 pKa = 10.11VLAVQATNSNGFGSDD131 pKa = 3.32ADD133 pKa = 3.47NSTVNRR139 pKa = 11.84SPATTIKK146 pKa = 10.81VYY148 pKa = 8.99VTNADD153 pKa = 4.01DD154 pKa = 5.05APGAPSAQNINVSEE168 pKa = 4.12NVTGVIATLSGGIDD182 pKa = 3.38QDD184 pKa = 3.35GDD186 pKa = 3.82AISYY190 pKa = 8.44VFSNGSTTYY199 pKa = 10.91GDD201 pKa = 3.62YY202 pKa = 10.77TISEE206 pKa = 4.69DD207 pKa = 3.68YY208 pKa = 10.52KK209 pKa = 11.33LSITRR214 pKa = 11.84AFDD217 pKa = 3.87YY218 pKa = 10.98EE219 pKa = 4.41SLPANNKK226 pKa = 6.4STSVAVYY233 pKa = 10.09SKK235 pKa = 11.68ANGKK239 pKa = 9.53ISANSANITLNITNANDD256 pKa = 3.25APYY259 pKa = 10.86VYY261 pKa = 9.03MGPSTISIKK270 pKa = 10.76EE271 pKa = 4.0NIPINTVIAEE281 pKa = 3.95FTINDD286 pKa = 3.61QDD288 pKa = 3.67NDD290 pKa = 4.1NITTTLGTSVLNNLLGLKK308 pKa = 9.34PKK310 pKa = 10.19AAIRR314 pKa = 11.84IFINCTT320 pKa = 3.01
Molecular weight: 33.58 kDa
Isoelectric point according different methods:
Protein with the highest isoelectric point:
>tr|A0A4D7C5M3|A0A4D7C5M3_9SPHN Uncharacterized protein OS=Hankyongella ginsenosidimutans OX=1763828 GN=E6W36_03330 PE=4 SV=1
MM1 pKa = 7.44AVSSVQVAITILLVTTWFILAVWALFRR28 pKa = 11.84SRR30 pKa = 11.84RR31 pKa = 11.84SSQRR35 pKa = 11.84ARR37 pKa = 11.84AARR40 pKa = 11.84AWALRR45 pKa = 11.84LRR47 pKa = 11.84ALISTTPGAISWRR60 pKa = 11.84RR61 pKa = 11.84GMSPSVQVAARR72 pKa = 11.84LAFAA76 pKa = 5.28
MM1 pKa = 7.44AVSSVQVAITILLVTTWFILAVWALFRR28 pKa = 11.84SRR30 pKa = 11.84RR31 pKa = 11.84SSQRR35 pKa = 11.84ARR37 pKa = 11.84AARR40 pKa = 11.84AWALRR45 pKa = 11.84LRR47 pKa = 11.84ALISTTPGAISWRR60 pKa = 11.84RR61 pKa = 11.84GMSPSVQVAARR72 pKa = 11.84LAFAA76 pKa = 5.28
Molecular weight: 8.4 kDa
Isoelectric point according different methods:
Peptides (in silico digests for buttom-up proteomics)
Below you can find in silico digests of the whole proteome with Trypsin, Chymotrypsin, Trypsin+LysC, LysN, ArgC proteases suitable for different mass spec machines.| Try ESI |
 |
|---|
| ChTry ESI |
 |
|---|
| ArgC ESI |
 |
|---|
| LysN ESI |
 |
|---|
| TryLysC ESI |
 |
|---|
| Try MALDI |
 |
|---|
| ChTry MALDI |
 |
|---|
| ArgC MALDI |
 |
|---|
| LysN MALDI |
 |
|---|
| TryLysC MALDI |
 |
|---|
| Try LTQ |
 |
|---|
| ChTry LTQ |
 |
|---|
| ArgC LTQ |
 |
|---|
| LysN LTQ |
 |
|---|
| TryLysC LTQ |
 |
|---|
| Try MSlow |
 |
|---|
| ChTry MSlow |
 |
|---|
| ArgC MSlow |
 |
|---|
| LysN MSlow |
 |
|---|
| TryLysC MSlow |
 |
|---|
| Try MShigh |
 |
|---|
| ChTry MShigh |
 |
|---|
| ArgC MShigh |
 |
|---|
| LysN MShigh |
 |
|---|
| TryLysC MShigh |
 |
|---|
General Statistics
Number of major isoforms |
Number of additional isoforms |
Number of all proteins |
Number of amino acids |
Min. Seq. Length |
Max. Seq. Length |
Avg. Seq. Length |
Avg. Mol. Weight |
|---|---|---|---|---|---|---|---|
0 |
414989 |
24 |
1110 |
209.9 |
22.68 |
Amino acid frequency
Ala |
Cys |
Asp |
Glu |
Phe |
Gly |
His |
Ile |
Lys |
Leu |
|---|---|---|---|---|---|---|---|---|---|
13.719 ± 0.088 | 1.125 ± 0.025 |
5.759 ± 0.054 | 4.605 ± 0.056 |
3.21 ± 0.037 | 8.384 ± 0.06 |
1.903 ± 0.032 | 4.497 ± 0.037 |
2.558 ± 0.049 | 10.29 ± 0.067 |
Met |
Asn |
Gln |
Pro |
Arg |
Ser |
Thr |
Val |
Trp |
Tyr |
|---|---|---|---|---|---|---|---|---|---|
2.205 ± 0.03 | 2.52 ± 0.041 |
5.545 ± 0.065 | 3.568 ± 0.038 |
8.514 ± 0.09 | 5.785 ± 0.056 |
5.504 ± 0.056 | 6.9 ± 0.053 |
1.397 ± 0.028 | 2.011 ± 0.031 |
Most of the basic statistics you can see at this page can be downloaded from this CSV file
Proteome-pI is available under Creative Commons Attribution-NoDerivs license, for more details see here
| Reference: Kozlowski LP. Proteome-pI 2.0: Proteome Isoelectric Point Database Update. Nucleic Acids Res. 2021, doi: 10.1093/nar/gkab944 | Contact: Lukasz P. Kozlowski |
