Flammeovirga sp. MY04
Taxonomy: cellular organisms; Bacteria; FCB group; Bacteroidetes/Chlorobi group; Bacteroidetes; Cytophagia; Cytophagales; Flammeovirgaceae; Flammeovirga; unclassified Flammeovirga
Average proteome isoelectric point is 6.11
Get precalculated fractions of proteins

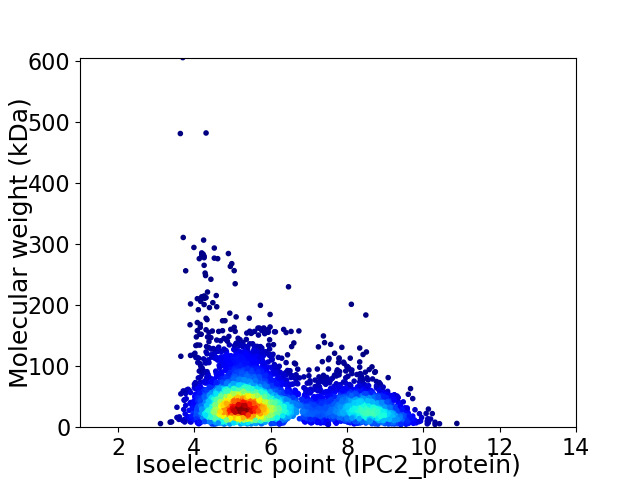
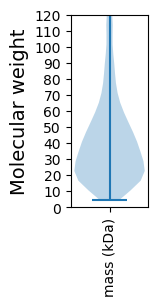
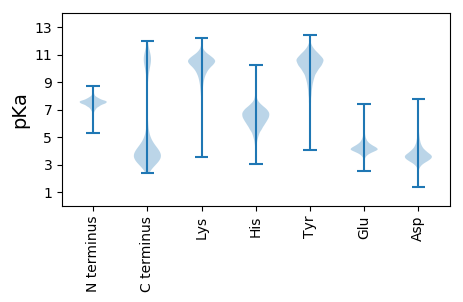
Virtual 2D-PAGE plot for 5417 proteins (isoelectric point calculated using IPC2_protein)
Get csv file with sequences according to given criteria:
* You can choose from 21 different methods for calculating isoelectric point
Summary statistics related to proteome-wise predictions


Protein with the lowest isoelectric point:
>tr|A0A1B1G1I7|A0A1B1G1I7_9BACT Sulfatase-like hydrolase/transferase OS=Flammeovirga sp. MY04 OX=1191459 GN=MY04_4845 PE=4 SV=1
MM1 pKa = 7.44KK2 pKa = 10.56LIARR6 pKa = 11.84LATLLLLSVCLFSCDD21 pKa = 5.32DD22 pKa = 5.31DD23 pKa = 6.69DD24 pKa = 7.34DD25 pKa = 5.55SDD27 pKa = 4.11PRR29 pKa = 11.84DD30 pKa = 3.36VNYY33 pKa = 10.36VYY35 pKa = 10.53FVTDD39 pKa = 4.91EE40 pKa = 4.08IPAPDD45 pKa = 3.96EE46 pKa = 4.58FGDD49 pKa = 4.6PNVQLQFNTSSNNIEE64 pKa = 4.08VVIRR68 pKa = 11.84TSVEE72 pKa = 3.25IGTAATTVVAEE83 pKa = 4.19YY84 pKa = 8.95TQDD87 pKa = 3.13VTSYY91 pKa = 11.24NRR93 pKa = 11.84DD94 pKa = 2.93GDD96 pKa = 3.89NYY98 pKa = 10.66SIQIDD103 pKa = 3.56SGSTYY108 pKa = 10.06NQEE111 pKa = 3.67LKK113 pKa = 10.91ADD115 pKa = 4.05VGCVSIPDD123 pKa = 3.77SGFSMGKK130 pKa = 6.25TTTSVSLDD138 pKa = 4.67DD139 pKa = 3.57ILVWDD144 pKa = 4.47SSNSKK149 pKa = 10.7YY150 pKa = 10.71YY151 pKa = 10.21IPGEE155 pKa = 4.02KK156 pKa = 9.65LGEE159 pKa = 4.02LLGVVVDD166 pKa = 4.4PEE168 pKa = 4.43FGQGGGGNVVYY179 pKa = 9.6PKK181 pKa = 9.69IWSSDD186 pKa = 3.18GSIMKK191 pKa = 10.42CGEE194 pKa = 4.2FPTNLPNN201 pKa = 4.15
MM1 pKa = 7.44KK2 pKa = 10.56LIARR6 pKa = 11.84LATLLLLSVCLFSCDD21 pKa = 5.32DD22 pKa = 5.31DD23 pKa = 6.69DD24 pKa = 7.34DD25 pKa = 5.55SDD27 pKa = 4.11PRR29 pKa = 11.84DD30 pKa = 3.36VNYY33 pKa = 10.36VYY35 pKa = 10.53FVTDD39 pKa = 4.91EE40 pKa = 4.08IPAPDD45 pKa = 3.96EE46 pKa = 4.58FGDD49 pKa = 4.6PNVQLQFNTSSNNIEE64 pKa = 4.08VVIRR68 pKa = 11.84TSVEE72 pKa = 3.25IGTAATTVVAEE83 pKa = 4.19YY84 pKa = 8.95TQDD87 pKa = 3.13VTSYY91 pKa = 11.24NRR93 pKa = 11.84DD94 pKa = 2.93GDD96 pKa = 3.89NYY98 pKa = 10.66SIQIDD103 pKa = 3.56SGSTYY108 pKa = 10.06NQEE111 pKa = 3.67LKK113 pKa = 10.91ADD115 pKa = 4.05VGCVSIPDD123 pKa = 3.77SGFSMGKK130 pKa = 6.25TTTSVSLDD138 pKa = 4.67DD139 pKa = 3.57ILVWDD144 pKa = 4.47SSNSKK149 pKa = 10.7YY150 pKa = 10.71YY151 pKa = 10.21IPGEE155 pKa = 4.02KK156 pKa = 9.65LGEE159 pKa = 4.02LLGVVVDD166 pKa = 4.4PEE168 pKa = 4.43FGQGGGGNVVYY179 pKa = 9.6PKK181 pKa = 9.69IWSSDD186 pKa = 3.18GSIMKK191 pKa = 10.42CGEE194 pKa = 4.2FPTNLPNN201 pKa = 4.15
Molecular weight: 21.78 kDa
Isoelectric point according different methods:
Protein with the highest isoelectric point:
>tr|A0A1B1FXI0|A0A1B1FXI0_9BACT 1 4-beta-xylanase OS=Flammeovirga sp. MY04 OX=1191459 GN=MY04_3522 PE=3 SV=1
MM1 pKa = 7.45KK2 pKa = 9.61RR3 pKa = 11.84TFQPSNRR10 pKa = 11.84KK11 pKa = 9.07RR12 pKa = 11.84KK13 pKa = 8.41NKK15 pKa = 9.86HH16 pKa = 4.44GFRR19 pKa = 11.84QRR21 pKa = 11.84MLTANGRR28 pKa = 11.84NVLASRR34 pKa = 11.84RR35 pKa = 11.84KK36 pKa = 9.6KK37 pKa = 10.04GRR39 pKa = 11.84KK40 pKa = 8.87SLTVSDD46 pKa = 4.03SRR48 pKa = 11.84KK49 pKa = 10.05HH50 pKa = 5.27KK51 pKa = 10.79AA52 pKa = 3.07
MM1 pKa = 7.45KK2 pKa = 9.61RR3 pKa = 11.84TFQPSNRR10 pKa = 11.84KK11 pKa = 9.07RR12 pKa = 11.84KK13 pKa = 8.41NKK15 pKa = 9.86HH16 pKa = 4.44GFRR19 pKa = 11.84QRR21 pKa = 11.84MLTANGRR28 pKa = 11.84NVLASRR34 pKa = 11.84RR35 pKa = 11.84KK36 pKa = 9.6KK37 pKa = 10.04GRR39 pKa = 11.84KK40 pKa = 8.87SLTVSDD46 pKa = 4.03SRR48 pKa = 11.84KK49 pKa = 10.05HH50 pKa = 5.27KK51 pKa = 10.79AA52 pKa = 3.07
Molecular weight: 6.15 kDa
Isoelectric point according different methods:
Peptides (in silico digests for buttom-up proteomics)
Below you can find in silico digests of the whole proteome with Trypsin, Chymotrypsin, Trypsin+LysC, LysN, ArgC proteases suitable for different mass spec machines.| Try ESI |
 |
|---|
| ChTry ESI |
 |
|---|
| ArgC ESI |
 |
|---|
| LysN ESI |
 |
|---|
| TryLysC ESI |
 |
|---|
| Try MALDI |
 |
|---|
| ChTry MALDI |
 |
|---|
| ArgC MALDI |
 |
|---|
| LysN MALDI |
 |
|---|
| TryLysC MALDI |
 |
|---|
| Try LTQ |
 |
|---|
| ChTry LTQ |
 |
|---|
| ArgC LTQ |
 |
|---|
| LysN LTQ |
 |
|---|
| TryLysC LTQ |
 |
|---|
| Try MSlow |
 |
|---|
| ChTry MSlow |
 |
|---|
| ArgC MSlow |
 |
|---|
| LysN MSlow |
 |
|---|
| TryLysC MSlow |
 |
|---|
| Try MShigh |
 |
|---|
| ChTry MShigh |
 |
|---|
| ArgC MShigh |
 |
|---|
| LysN MShigh |
 |
|---|
| TryLysC MShigh |
 |
|---|
General Statistics
Number of major isoforms |
Number of additional isoforms |
Number of all proteins |
Number of amino acids |
Min. Seq. Length |
Max. Seq. Length |
Avg. Seq. Length |
Avg. Mol. Weight |
|---|---|---|---|---|---|---|---|
2124546 |
36 |
5547 |
392.2 |
44.41 |
Amino acid frequency
Ala |
Cys |
Asp |
Glu |
Phe |
Gly |
His |
Ile |
Lys |
Leu |
|---|---|---|---|---|---|---|---|---|---|
5.794 ± 0.036 | 0.713 ± 0.009 |
6.042 ± 0.026 | 6.929 ± 0.035 |
5.069 ± 0.023 | 6.569 ± 0.036 |
1.941 ± 0.014 | 7.494 ± 0.029 |
7.479 ± 0.052 | 8.881 ± 0.035 |
Met |
Asn |
Gln |
Pro |
Arg |
Ser |
Thr |
Val |
Trp |
Tyr |
|---|---|---|---|---|---|---|---|---|---|
2.355 ± 0.015 | 6.059 ± 0.032 |
3.389 ± 0.021 | 3.68 ± 0.018 |
3.361 ± 0.023 | 6.694 ± 0.029 |
5.678 ± 0.041 | 6.303 ± 0.029 |
1.219 ± 0.013 | 4.35 ± 0.021 |
Most of the basic statistics you can see at this page can be downloaded from this CSV file
Proteome-pI is available under Creative Commons Attribution-NoDerivs license, for more details see here
| Reference: Kozlowski LP. Proteome-pI 2.0: Proteome Isoelectric Point Database Update. Nucleic Acids Res. 2021, doi: 10.1093/nar/gkab944 | Contact: Lukasz P. Kozlowski |
