Cercospora zeina
Taxonomy: cellular organisms; Eukaryota; Opisthokonta; Fungi; Dikarya; Ascomycota; saccharomyceta; Pezizomycotina; leotiomyceta; dothideomyceta; Dothideomycetes; Dothideomycetidae; Mycosphaerellales; Mycosphaerellaceae; Cercospora
Average proteome isoelectric point is 6.56
Get precalculated fractions of proteins

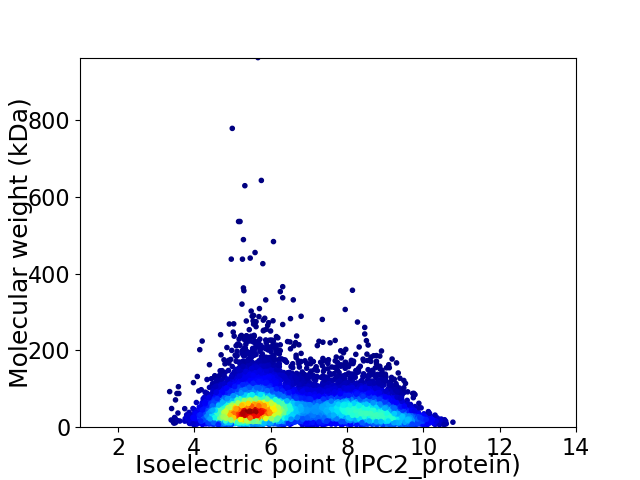
Virtual 2D-PAGE plot for 10192 proteins (isoelectric point calculated using IPC2_protein)
Get csv file with sequences according to given criteria:
* You can choose from 21 different methods for calculating isoelectric point
Summary statistics related to proteome-wise predictions


Protein with the lowest isoelectric point:
>tr|A0A2I0S9N7|A0A2I0S9N7_9PEZI Putative oxidoreductase YkvO OS=Cercospora zeina OX=348901 GN=BST61_czeina2g001900 PE=4 SV=1
MM1 pKa = 7.28FLSTAATAIALLASTVAAIPASLTSMAEE29 pKa = 4.03NPNLEE34 pKa = 3.89ITEE37 pKa = 4.13LVINSTANGNTMLQFNVQNPEE58 pKa = 3.66PLAANGIAEE67 pKa = 5.14CRR69 pKa = 11.84GEE71 pKa = 4.04WDD73 pKa = 3.34TTKK76 pKa = 10.61QDD78 pKa = 3.14WPISGEE84 pKa = 4.58ALTCDD89 pKa = 3.97NSTSMTWYY97 pKa = 9.2IDD99 pKa = 3.0SWTSAMNFVINIQDD113 pKa = 3.57RR114 pKa = 11.84FDD116 pKa = 4.33DD117 pKa = 4.39PSVGKK122 pKa = 9.38PPYY125 pKa = 10.9DD126 pKa = 3.89RR127 pKa = 11.84MTTFSKK133 pKa = 10.95AIINEE138 pKa = 4.37TVVSYY143 pKa = 11.35ASDD146 pKa = 3.58TPAGNTNAGTDD157 pKa = 3.94APPEE161 pKa = 4.63SISGSQLPDD170 pKa = 2.83ITIYY174 pKa = 10.9AVVYY178 pKa = 10.24AVSAA182 pKa = 3.86
MM1 pKa = 7.28FLSTAATAIALLASTVAAIPASLTSMAEE29 pKa = 4.03NPNLEE34 pKa = 3.89ITEE37 pKa = 4.13LVINSTANGNTMLQFNVQNPEE58 pKa = 3.66PLAANGIAEE67 pKa = 5.14CRR69 pKa = 11.84GEE71 pKa = 4.04WDD73 pKa = 3.34TTKK76 pKa = 10.61QDD78 pKa = 3.14WPISGEE84 pKa = 4.58ALTCDD89 pKa = 3.97NSTSMTWYY97 pKa = 9.2IDD99 pKa = 3.0SWTSAMNFVINIQDD113 pKa = 3.57RR114 pKa = 11.84FDD116 pKa = 4.33DD117 pKa = 4.39PSVGKK122 pKa = 9.38PPYY125 pKa = 10.9DD126 pKa = 3.89RR127 pKa = 11.84MTTFSKK133 pKa = 10.95AIINEE138 pKa = 4.37TVVSYY143 pKa = 11.35ASDD146 pKa = 3.58TPAGNTNAGTDD157 pKa = 3.94APPEE161 pKa = 4.63SISGSQLPDD170 pKa = 2.83ITIYY174 pKa = 10.9AVVYY178 pKa = 10.24AVSAA182 pKa = 3.86
Molecular weight: 19.38 kDa
Isoelectric point according different methods:
Protein with the highest isoelectric point:
>tr|A0A2I0RS63|A0A2I0RS63_9PEZI DNA replication checkpoint protein tel2 OS=Cercospora zeina OX=348901 GN=BST61_czeina50g000040 PE=3 SV=1
MM1 pKa = 6.82VTGQRR6 pKa = 11.84ACVRR10 pKa = 11.84RR11 pKa = 11.84VRR13 pKa = 11.84RR14 pKa = 11.84MWCRR18 pKa = 11.84RR19 pKa = 11.84KK20 pKa = 9.77AVGWTKK26 pKa = 9.36HH27 pKa = 5.17TICRR31 pKa = 11.84HH32 pKa = 6.03DD33 pKa = 3.85AFQYY37 pKa = 7.49ATPDD41 pKa = 3.45MQRR44 pKa = 11.84VKK46 pKa = 10.76YY47 pKa = 10.0HH48 pKa = 5.95VEE50 pKa = 3.42ASLRR54 pKa = 11.84SINVEE59 pKa = 4.15VQQHH63 pKa = 4.21VAKK66 pKa = 10.7SRR68 pKa = 11.84IAGAGASNVSFAGGSPTCCCWISDD92 pKa = 3.83AVGLKK97 pKa = 10.33NIWPWQSSRR106 pKa = 11.84GQWRR110 pKa = 11.84TLVIMRR116 pKa = 11.84TGGSNRR122 pKa = 11.84SPEE125 pKa = 4.15AASHH129 pKa = 6.73CDD131 pKa = 3.29ATFHH135 pKa = 6.15GQQ137 pKa = 2.94
MM1 pKa = 6.82VTGQRR6 pKa = 11.84ACVRR10 pKa = 11.84RR11 pKa = 11.84VRR13 pKa = 11.84RR14 pKa = 11.84MWCRR18 pKa = 11.84RR19 pKa = 11.84KK20 pKa = 9.77AVGWTKK26 pKa = 9.36HH27 pKa = 5.17TICRR31 pKa = 11.84HH32 pKa = 6.03DD33 pKa = 3.85AFQYY37 pKa = 7.49ATPDD41 pKa = 3.45MQRR44 pKa = 11.84VKK46 pKa = 10.76YY47 pKa = 10.0HH48 pKa = 5.95VEE50 pKa = 3.42ASLRR54 pKa = 11.84SINVEE59 pKa = 4.15VQQHH63 pKa = 4.21VAKK66 pKa = 10.7SRR68 pKa = 11.84IAGAGASNVSFAGGSPTCCCWISDD92 pKa = 3.83AVGLKK97 pKa = 10.33NIWPWQSSRR106 pKa = 11.84GQWRR110 pKa = 11.84TLVIMRR116 pKa = 11.84TGGSNRR122 pKa = 11.84SPEE125 pKa = 4.15AASHH129 pKa = 6.73CDD131 pKa = 3.29ATFHH135 pKa = 6.15GQQ137 pKa = 2.94
Molecular weight: 15.36 kDa
Isoelectric point according different methods:
Peptides (in silico digests for buttom-up proteomics)
Below you can find in silico digests of the whole proteome with Trypsin, Chymotrypsin, Trypsin+LysC, LysN, ArgC proteases suitable for different mass spec machines.| Try ESI |
 |
|---|
| ChTry ESI |
 |
|---|
| ArgC ESI |
 |
|---|
| LysN ESI |
 |
|---|
| TryLysC ESI |
 |
|---|
| Try MALDI |
 |
|---|
| ChTry MALDI |
 |
|---|
| ArgC MALDI |
 |
|---|
| LysN MALDI |
 |
|---|
| TryLysC MALDI |
 |
|---|
| Try LTQ |
 |
|---|
| ChTry LTQ |
 |
|---|
| ArgC LTQ |
 |
|---|
| LysN LTQ |
 |
|---|
| TryLysC LTQ |
 |
|---|
| Try MSlow |
 |
|---|
| ChTry MSlow |
 |
|---|
| ArgC MSlow |
 |
|---|
| LysN MSlow |
 |
|---|
| TryLysC MSlow |
 |
|---|
| Try MShigh |
 |
|---|
| ChTry MShigh |
 |
|---|
| ArgC MShigh |
 |
|---|
| LysN MShigh |
 |
|---|
| TryLysC MShigh |
 |
|---|
General Statistics
Number of major isoforms |
Number of additional isoforms |
Number of all proteins |
Number of amino acids |
Min. Seq. Length |
Max. Seq. Length |
Avg. Seq. Length |
Avg. Mol. Weight |
|---|---|---|---|---|---|---|---|
0 |
5190240 |
58 |
8800 |
509.2 |
56.23 |
Amino acid frequency
Ala |
Cys |
Asp |
Glu |
Phe |
Gly |
His |
Ile |
Lys |
Leu |
|---|---|---|---|---|---|---|---|---|---|
9.358 ± 0.02 | 1.221 ± 0.009 |
5.744 ± 0.018 | 6.192 ± 0.024 |
3.507 ± 0.014 | 6.912 ± 0.022 |
2.544 ± 0.011 | 4.545 ± 0.015 |
4.812 ± 0.023 | 8.547 ± 0.025 |
Met |
Asn |
Gln |
Pro |
Arg |
Ser |
Thr |
Val |
Trp |
Tyr |
|---|---|---|---|---|---|---|---|---|---|
2.184 ± 0.009 | 3.6 ± 0.012 |
6.03 ± 0.025 | 4.306 ± 0.018 |
6.33 ± 0.021 | 8.007 ± 0.026 |
6.053 ± 0.02 | 6.001 ± 0.015 |
1.428 ± 0.009 | 2.675 ± 0.012 |
Most of the basic statistics you can see at this page can be downloaded from this CSV file
Proteome-pI is available under Creative Commons Attribution-NoDerivs license, for more details see here
| Reference: Kozlowski LP. Proteome-pI 2.0: Proteome Isoelectric Point Database Update. Nucleic Acids Res. 2021, doi: 10.1093/nar/gkab944 | Contact: Lukasz P. Kozlowski |
