Hydrotalea sandarakina
Taxonomy: cellular organisms; Bacteria; FCB group; Bacteroidetes/Chlorobi group; Bacteroidetes; Chitinophagia; Chitinophagales; Chitinophagaceae; Hydrotalea
Average proteome isoelectric point is 7.1
Get precalculated fractions of proteins

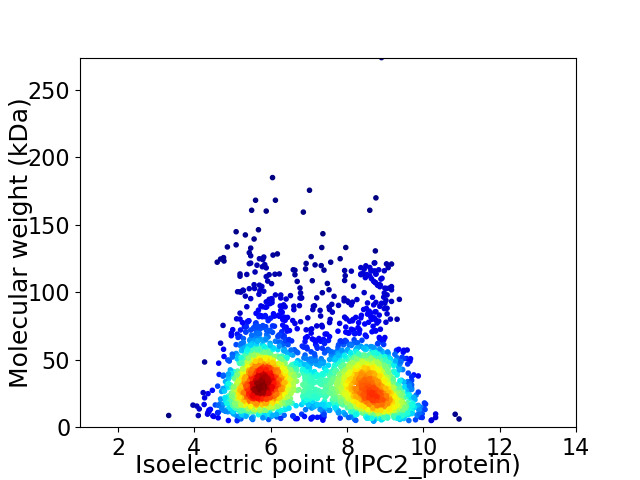
Virtual 2D-PAGE plot for 2813 proteins (isoelectric point calculated using IPC2_protein)
Get csv file with sequences according to given criteria:
* You can choose from 21 different methods for calculating isoelectric point
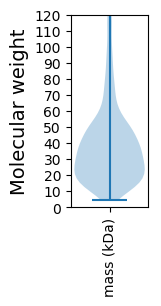
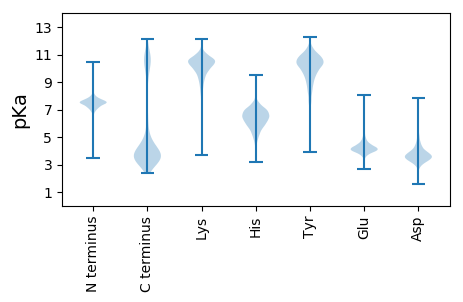
Summary statistics related to proteome-wise predictions


Protein with the lowest isoelectric point:
>tr|A0A2W7RVH0|A0A2W7RVH0_9BACT PAS domain S-box-containing protein OS=Hydrotalea sandarakina OX=1004304 GN=LX80_01530 PE=4 SV=1
MM1 pKa = 7.54LVQEE5 pKa = 4.81YY6 pKa = 10.53KK7 pKa = 9.19RR8 pKa = 11.84TYY10 pKa = 10.6YY11 pKa = 10.19PILQLTDD18 pKa = 3.24TAKK21 pKa = 10.22QAIVLMEE28 pKa = 4.9DD29 pKa = 3.83YY30 pKa = 10.34FVEE33 pKa = 4.13HH34 pKa = 6.75WPVCTNGTFVGILNRR49 pKa = 11.84DD50 pKa = 3.27ALASVSEE57 pKa = 4.14EE58 pKa = 3.78ASLSEE63 pKa = 5.39LIDD66 pKa = 3.37EE67 pKa = 5.79FIPVAVLNTDD77 pKa = 4.81FIFTAVKK84 pKa = 10.05LAALNHH90 pKa = 5.65LTLVPVVTPEE100 pKa = 4.32NILDD104 pKa = 4.75GIVTANDD111 pKa = 3.66LLRR114 pKa = 11.84ATAHH118 pKa = 4.65YY119 pKa = 9.42TGIEE123 pKa = 4.19LPGGTIVLQMEE134 pKa = 4.18RR135 pKa = 11.84KK136 pKa = 8.34EE137 pKa = 4.05YY138 pKa = 11.0SFGEE142 pKa = 4.0INRR145 pKa = 11.84LVEE148 pKa = 4.14TNDD151 pKa = 3.74AFITQLNSSINSNNGLLDD169 pKa = 3.86VIIKK173 pKa = 10.03INKK176 pKa = 8.06TEE178 pKa = 3.84ISDD181 pKa = 3.86VVATFQRR188 pKa = 11.84YY189 pKa = 7.62EE190 pKa = 4.19YY191 pKa = 10.93NVLYY195 pKa = 10.8YY196 pKa = 10.79LGDD199 pKa = 3.05EE200 pKa = 4.51WYY202 pKa = 9.75TNEE205 pKa = 5.81LKK207 pKa = 10.91DD208 pKa = 4.58NYY210 pKa = 9.92NNLMNYY216 pKa = 10.36LNVV219 pKa = 3.46
MM1 pKa = 7.54LVQEE5 pKa = 4.81YY6 pKa = 10.53KK7 pKa = 9.19RR8 pKa = 11.84TYY10 pKa = 10.6YY11 pKa = 10.19PILQLTDD18 pKa = 3.24TAKK21 pKa = 10.22QAIVLMEE28 pKa = 4.9DD29 pKa = 3.83YY30 pKa = 10.34FVEE33 pKa = 4.13HH34 pKa = 6.75WPVCTNGTFVGILNRR49 pKa = 11.84DD50 pKa = 3.27ALASVSEE57 pKa = 4.14EE58 pKa = 3.78ASLSEE63 pKa = 5.39LIDD66 pKa = 3.37EE67 pKa = 5.79FIPVAVLNTDD77 pKa = 4.81FIFTAVKK84 pKa = 10.05LAALNHH90 pKa = 5.65LTLVPVVTPEE100 pKa = 4.32NILDD104 pKa = 4.75GIVTANDD111 pKa = 3.66LLRR114 pKa = 11.84ATAHH118 pKa = 4.65YY119 pKa = 9.42TGIEE123 pKa = 4.19LPGGTIVLQMEE134 pKa = 4.18RR135 pKa = 11.84KK136 pKa = 8.34EE137 pKa = 4.05YY138 pKa = 11.0SFGEE142 pKa = 4.0INRR145 pKa = 11.84LVEE148 pKa = 4.14TNDD151 pKa = 3.74AFITQLNSSINSNNGLLDD169 pKa = 3.86VIIKK173 pKa = 10.03INKK176 pKa = 8.06TEE178 pKa = 3.84ISDD181 pKa = 3.86VVATFQRR188 pKa = 11.84YY189 pKa = 7.62EE190 pKa = 4.19YY191 pKa = 10.93NVLYY195 pKa = 10.8YY196 pKa = 10.79LGDD199 pKa = 3.05EE200 pKa = 4.51WYY202 pKa = 9.75TNEE205 pKa = 5.81LKK207 pKa = 10.91DD208 pKa = 4.58NYY210 pKa = 9.92NNLMNYY216 pKa = 10.36LNVV219 pKa = 3.46
Molecular weight: 24.85 kDa
Isoelectric point according different methods:
Protein with the highest isoelectric point:
>tr|A0A2W7S965|A0A2W7S965_9BACT Mercuric transport protein MerT OS=Hydrotalea sandarakina OX=1004304 GN=LX80_02811 PE=3 SV=1
MM1 pKa = 7.38KK2 pKa = 9.59RR3 pKa = 11.84TFQPHH8 pKa = 4.67KK9 pKa = 9.7RR10 pKa = 11.84RR11 pKa = 11.84RR12 pKa = 11.84KK13 pKa = 8.4SVHH16 pKa = 5.0GFRR19 pKa = 11.84KK20 pKa = 10.11RR21 pKa = 11.84MQTANGRR28 pKa = 11.84KK29 pKa = 8.63VLASRR34 pKa = 11.84RR35 pKa = 11.84RR36 pKa = 11.84KK37 pKa = 9.28GRR39 pKa = 11.84KK40 pKa = 8.75KK41 pKa = 9.98LTVSSEE47 pKa = 4.1KK48 pKa = 10.7GLKK51 pKa = 9.34
MM1 pKa = 7.38KK2 pKa = 9.59RR3 pKa = 11.84TFQPHH8 pKa = 4.67KK9 pKa = 9.7RR10 pKa = 11.84RR11 pKa = 11.84RR12 pKa = 11.84KK13 pKa = 8.4SVHH16 pKa = 5.0GFRR19 pKa = 11.84KK20 pKa = 10.11RR21 pKa = 11.84MQTANGRR28 pKa = 11.84KK29 pKa = 8.63VLASRR34 pKa = 11.84RR35 pKa = 11.84RR36 pKa = 11.84KK37 pKa = 9.28GRR39 pKa = 11.84KK40 pKa = 8.75KK41 pKa = 9.98LTVSSEE47 pKa = 4.1KK48 pKa = 10.7GLKK51 pKa = 9.34
Molecular weight: 6.1 kDa
Isoelectric point according different methods:
Peptides (in silico digests for buttom-up proteomics)
Below you can find in silico digests of the whole proteome with Trypsin, Chymotrypsin, Trypsin+LysC, LysN, ArgC proteases suitable for different mass spec machines.| Try ESI |
 |
|---|
| ChTry ESI |
 |
|---|
| ArgC ESI |
 |
|---|
| LysN ESI |
 |
|---|
| TryLysC ESI |
 |
|---|
| Try MALDI |
 |
|---|
| ChTry MALDI |
 |
|---|
| ArgC MALDI |
 |
|---|
| LysN MALDI |
 |
|---|
| TryLysC MALDI |
 |
|---|
| Try LTQ |
 |
|---|
| ChTry LTQ |
 |
|---|
| ArgC LTQ |
 |
|---|
| LysN LTQ |
 |
|---|
| TryLysC LTQ |
 |
|---|
| Try MSlow |
 |
|---|
| ChTry MSlow |
 |
|---|
| ArgC MSlow |
 |
|---|
| LysN MSlow |
 |
|---|
| TryLysC MSlow |
 |
|---|
| Try MShigh |
 |
|---|
| ChTry MShigh |
 |
|---|
| ArgC MShigh |
 |
|---|
| LysN MShigh |
 |
|---|
| TryLysC MShigh |
 |
|---|
General Statistics
Number of major isoforms |
Number of additional isoforms |
Number of all proteins |
Number of amino acids |
Min. Seq. Length |
Max. Seq. Length |
Avg. Seq. Length |
Avg. Mol. Weight |
|---|---|---|---|---|---|---|---|
0 |
986317 |
39 |
2437 |
350.6 |
39.4 |
Amino acid frequency
Ala |
Cys |
Asp |
Glu |
Phe |
Gly |
His |
Ile |
Lys |
Leu |
|---|---|---|---|---|---|---|---|---|---|
7.646 ± 0.046 | 0.899 ± 0.015 |
4.527 ± 0.034 | 5.158 ± 0.051 |
4.979 ± 0.035 | 6.415 ± 0.039 |
2.147 ± 0.024 | 7.899 ± 0.041 |
6.821 ± 0.038 | 9.534 ± 0.048 |
Met |
Asn |
Gln |
Pro |
Arg |
Ser |
Thr |
Val |
Trp |
Tyr |
|---|---|---|---|---|---|---|---|---|---|
2.382 ± 0.02 | 6.479 ± 0.048 |
4.004 ± 0.023 | 4.637 ± 0.031 |
3.25 ± 0.026 | 5.692 ± 0.039 |
5.854 ± 0.033 | 6.189 ± 0.033 |
1.269 ± 0.021 | 4.219 ± 0.033 |
Most of the basic statistics you can see at this page can be downloaded from this CSV file
Proteome-pI is available under Creative Commons Attribution-NoDerivs license, for more details see here
| Reference: Kozlowski LP. Proteome-pI 2.0: Proteome Isoelectric Point Database Update. Nucleic Acids Res. 2021, doi: 10.1093/nar/gkab944 | Contact: Lukasz P. Kozlowski |
