Aquicella lusitana
Taxonomy: cellular organisms; Bacteria; Proteobacteria; Gammaproteobacteria; Legionellales; Coxiellaceae; Aquicella
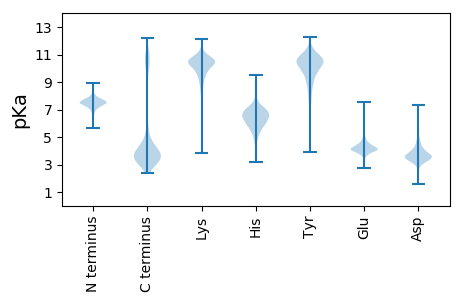
Average proteome isoelectric point is 7.04
Get precalculated fractions of proteins

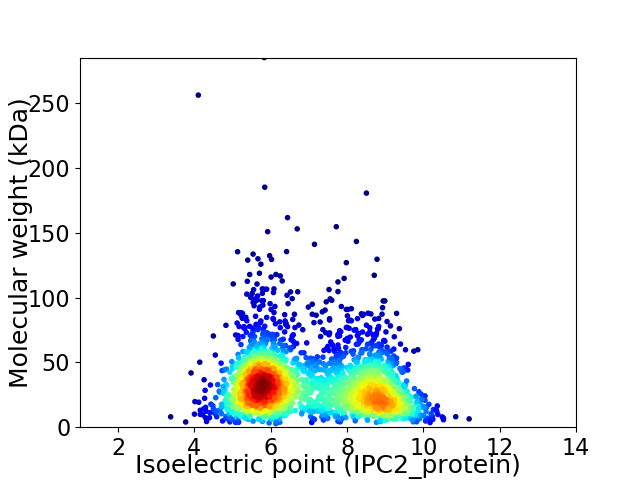
Virtual 2D-PAGE plot for 2370 proteins (isoelectric point calculated using IPC2_protein)
Get csv file with sequences according to given criteria:
* You can choose from 21 different methods for calculating isoelectric point
Summary statistics related to proteome-wise predictions


Protein with the lowest isoelectric point:
>tr|A0A370G8C2|A0A370G8C2_9COXI Hemolysin activation/secretion protein OS=Aquicella lusitana OX=254246 GN=C8D86_1242 PE=3 SV=1
MM1 pKa = 7.88GIGNIATTGMQAAMTNMEE19 pKa = 4.59VISNNIANSNTFGYY33 pKa = 9.52KK34 pKa = 10.12GSYY37 pKa = 11.04ANFADD42 pKa = 4.74MYY44 pKa = 9.92PSGSNASSVQAGLGVSVSGIQQDD67 pKa = 4.22FSPGGPTPTGIASDD81 pKa = 3.68LTITNDD87 pKa = 3.05GFFVLKK93 pKa = 10.33DD94 pKa = 3.47ASSGQTSYY102 pKa = 11.65SRR104 pKa = 11.84FGRR107 pKa = 11.84FNFNQGYY114 pKa = 9.81FMVGNQRR121 pKa = 11.84LQGFPAVNNTIPPGSTPTDD140 pKa = 3.82LYY142 pKa = 10.69INTASIPAQATGTITQQQLNLNASDD167 pKa = 4.38SVPSTTPFDD176 pKa = 4.88PNDD179 pKa = 3.5PTSFNFSSTATVYY192 pKa = 11.09DD193 pKa = 3.73SLGSSNTLNLYY204 pKa = 8.13YY205 pKa = 10.83VKK207 pKa = 9.78TAANEE212 pKa = 4.12WTVNAYY218 pKa = 10.71VNGTSVGTGSLTFSSDD234 pKa = 2.95GTLSSATGLSNLSFSPTSGATSPQVFSVSMTGATQYY270 pKa = 11.47ANPYY274 pKa = 6.78TANPFSSDD282 pKa = 2.78GYY284 pKa = 10.24AAGNFTGYY292 pKa = 9.28TIDD295 pKa = 3.55KK296 pKa = 9.38NGKK299 pKa = 7.45VTVNYY304 pKa = 10.55SNNQTTVAGQIALAMFQSPQGLQNVGNMSWIATSDD339 pKa = 3.38SGEE342 pKa = 4.2PNVNQANSQNGIQQAALEE360 pKa = 4.18MSNVDD365 pKa = 3.93LASEE369 pKa = 4.29MVSLITAQNIFQANAQVEE387 pKa = 4.29QVYY390 pKa = 9.31NQVMQTVTKK399 pKa = 10.48LAA401 pKa = 3.85
MM1 pKa = 7.88GIGNIATTGMQAAMTNMEE19 pKa = 4.59VISNNIANSNTFGYY33 pKa = 9.52KK34 pKa = 10.12GSYY37 pKa = 11.04ANFADD42 pKa = 4.74MYY44 pKa = 9.92PSGSNASSVQAGLGVSVSGIQQDD67 pKa = 4.22FSPGGPTPTGIASDD81 pKa = 3.68LTITNDD87 pKa = 3.05GFFVLKK93 pKa = 10.33DD94 pKa = 3.47ASSGQTSYY102 pKa = 11.65SRR104 pKa = 11.84FGRR107 pKa = 11.84FNFNQGYY114 pKa = 9.81FMVGNQRR121 pKa = 11.84LQGFPAVNNTIPPGSTPTDD140 pKa = 3.82LYY142 pKa = 10.69INTASIPAQATGTITQQQLNLNASDD167 pKa = 4.38SVPSTTPFDD176 pKa = 4.88PNDD179 pKa = 3.5PTSFNFSSTATVYY192 pKa = 11.09DD193 pKa = 3.73SLGSSNTLNLYY204 pKa = 8.13YY205 pKa = 10.83VKK207 pKa = 9.78TAANEE212 pKa = 4.12WTVNAYY218 pKa = 10.71VNGTSVGTGSLTFSSDD234 pKa = 2.95GTLSSATGLSNLSFSPTSGATSPQVFSVSMTGATQYY270 pKa = 11.47ANPYY274 pKa = 6.78TANPFSSDD282 pKa = 2.78GYY284 pKa = 10.24AAGNFTGYY292 pKa = 9.28TIDD295 pKa = 3.55KK296 pKa = 9.38NGKK299 pKa = 7.45VTVNYY304 pKa = 10.55SNNQTTVAGQIALAMFQSPQGLQNVGNMSWIATSDD339 pKa = 3.38SGEE342 pKa = 4.2PNVNQANSQNGIQQAALEE360 pKa = 4.18MSNVDD365 pKa = 3.93LASEE369 pKa = 4.29MVSLITAQNIFQANAQVEE387 pKa = 4.29QVYY390 pKa = 9.31NQVMQTVTKK399 pKa = 10.48LAA401 pKa = 3.85
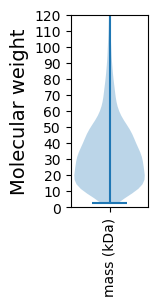
Molecular weight: 41.89 kDa
Isoelectric point according different methods:
Protein with the highest isoelectric point:
>tr|A0A370GMY4|A0A370GMY4_9COXI Uncharacterized protein OS=Aquicella lusitana OX=254246 GN=C8D86_11054 PE=4 SV=1
MM1 pKa = 7.52AKK3 pKa = 10.04ARR5 pKa = 11.84SSAKK9 pKa = 10.22RR10 pKa = 11.84KK11 pKa = 6.51TSKK14 pKa = 9.85VAKK17 pKa = 9.79AKK19 pKa = 9.53PRR21 pKa = 11.84KK22 pKa = 6.55TARR25 pKa = 11.84KK26 pKa = 8.9KK27 pKa = 9.42KK28 pKa = 7.08TAKK31 pKa = 8.89TVKK34 pKa = 10.14KK35 pKa = 10.15AATKK39 pKa = 10.38KK40 pKa = 8.92RR41 pKa = 11.84TGGRR45 pKa = 11.84KK46 pKa = 8.02RR47 pKa = 11.84TTAKK51 pKa = 10.02RR52 pKa = 11.84KK53 pKa = 9.3KK54 pKa = 9.5AAKK57 pKa = 9.68KK58 pKa = 10.12
MM1 pKa = 7.52AKK3 pKa = 10.04ARR5 pKa = 11.84SSAKK9 pKa = 10.22RR10 pKa = 11.84KK11 pKa = 6.51TSKK14 pKa = 9.85VAKK17 pKa = 9.79AKK19 pKa = 9.53PRR21 pKa = 11.84KK22 pKa = 6.55TARR25 pKa = 11.84KK26 pKa = 8.9KK27 pKa = 9.42KK28 pKa = 7.08TAKK31 pKa = 8.89TVKK34 pKa = 10.14KK35 pKa = 10.15AATKK39 pKa = 10.38KK40 pKa = 8.92RR41 pKa = 11.84TGGRR45 pKa = 11.84KK46 pKa = 8.02RR47 pKa = 11.84TTAKK51 pKa = 10.02RR52 pKa = 11.84KK53 pKa = 9.3KK54 pKa = 9.5AAKK57 pKa = 9.68KK58 pKa = 10.12
Molecular weight: 6.42 kDa
Isoelectric point according different methods:
Peptides (in silico digests for buttom-up proteomics)
Below you can find in silico digests of the whole proteome with Trypsin, Chymotrypsin, Trypsin+LysC, LysN, ArgC proteases suitable for different mass spec machines.| Try ESI |
 |
|---|
| ChTry ESI |
 |
|---|
| ArgC ESI |
 |
|---|
| LysN ESI |
 |
|---|
| TryLysC ESI |
 |
|---|
| Try MALDI |
 |
|---|
| ChTry MALDI |
 |
|---|
| ArgC MALDI |
 |
|---|
| LysN MALDI |
 |
|---|
| TryLysC MALDI |
 |
|---|
| Try LTQ |
 |
|---|
| ChTry LTQ |
 |
|---|
| ArgC LTQ |
 |
|---|
| LysN LTQ |
 |
|---|
| TryLysC LTQ |
 |
|---|
| Try MSlow |
 |
|---|
| ChTry MSlow |
 |
|---|
| ArgC MSlow |
 |
|---|
| LysN MSlow |
 |
|---|
| TryLysC MSlow |
 |
|---|
| Try MShigh |
 |
|---|
| ChTry MShigh |
 |
|---|
| ArgC MShigh |
 |
|---|
| LysN MShigh |
 |
|---|
| TryLysC MShigh |
 |
|---|
General Statistics
Number of major isoforms |
Number of additional isoforms |
Number of all proteins |
Number of amino acids |
Min. Seq. Length |
Max. Seq. Length |
Avg. Seq. Length |
Avg. Mol. Weight |
|---|---|---|---|---|---|---|---|
0 |
748558 |
25 |
2565 |
315.8 |
35.39 |
Amino acid frequency
Ala |
Cys |
Asp |
Glu |
Phe |
Gly |
His |
Ile |
Lys |
Leu |
|---|---|---|---|---|---|---|---|---|---|
8.487 ± 0.051 | 1.084 ± 0.015 |
4.787 ± 0.039 | 5.875 ± 0.057 |
4.395 ± 0.043 | 6.259 ± 0.049 |
2.519 ± 0.029 | 7.336 ± 0.043 |
6.065 ± 0.058 | 10.705 ± 0.064 |
Met |
Asn |
Gln |
Pro |
Arg |
Ser |
Thr |
Val |
Trp |
Tyr |
|---|---|---|---|---|---|---|---|---|---|
2.534 ± 0.024 | 4.272 ± 0.047 |
4.329 ± 0.034 | 4.386 ± 0.036 |
4.837 ± 0.042 | 6.105 ± 0.044 |
5.323 ± 0.047 | 6.151 ± 0.039 |
1.168 ± 0.022 | 3.383 ± 0.031 |
Most of the basic statistics you can see at this page can be downloaded from this CSV file
Proteome-pI is available under Creative Commons Attribution-NoDerivs license, for more details see here
| Reference: Kozlowski LP. Proteome-pI 2.0: Proteome Isoelectric Point Database Update. Nucleic Acids Res. 2021, doi: 10.1093/nar/gkab944 | Contact: Lukasz P. Kozlowski |
