Cellulomonas composti
Taxonomy: cellular organisms; Bacteria; Terrabacteria group; Actinobacteria; Actinomycetia; Micrococcales; Cellulomonadaceae; Cellulomonas
Average proteome isoelectric point is 5.99
Get precalculated fractions of proteins
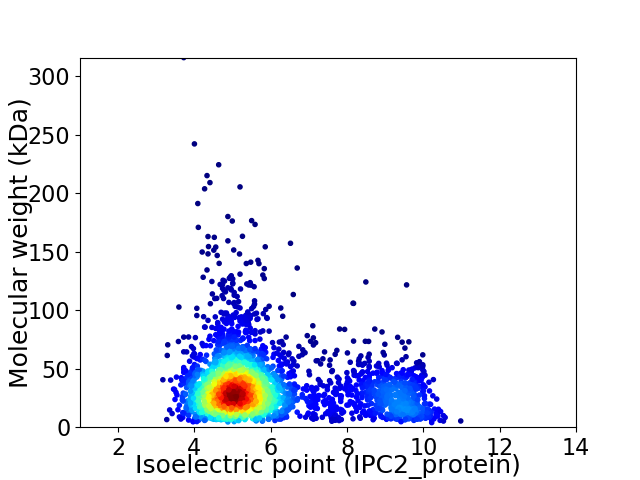
Virtual 2D-PAGE plot for 3111 proteins (isoelectric point calculated using IPC2_protein)
Get csv file with sequences according to given criteria:
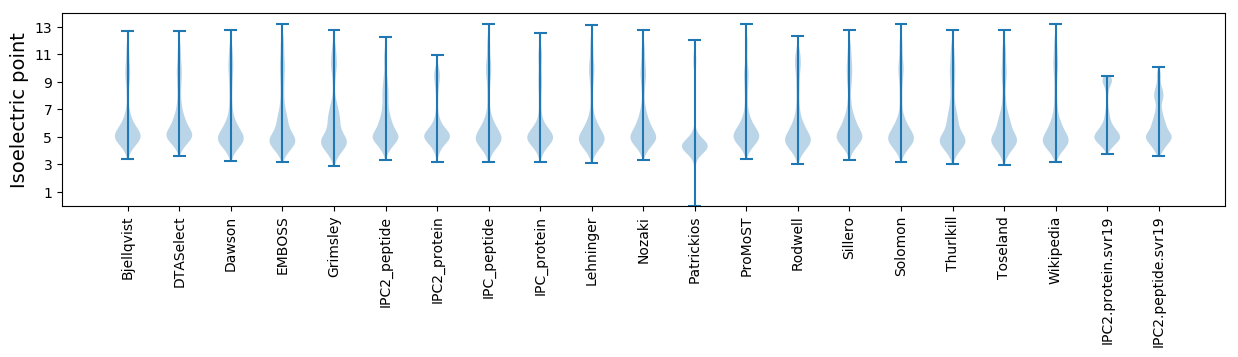
* You can choose from 21 different methods for calculating isoelectric point
Summary statistics related to proteome-wise predictions
Protein with the lowest isoelectric point:
>tr|A0A511JE20|A0A511JE20_9CELL Ribosomal RNA small subunit methyltransferase E OS=Cellulomonas composti OX=266130 GN=CCO02nite_28440 PE=3 SV=1
MM1 pKa = 7.55IGGAPGRR8 pKa = 11.84WGGALLLVVLAVLTSACGGHH28 pKa = 6.74AAATEE33 pKa = 4.13SSNAEE38 pKa = 3.76SVAFSGEE45 pKa = 4.06VPEE48 pKa = 5.42FEE50 pKa = 4.37GPYY53 pKa = 9.85AAEE56 pKa = 3.81FADD59 pKa = 5.12FYY61 pKa = 11.26VHH63 pKa = 5.92STSEE67 pKa = 3.82FVRR70 pKa = 11.84AVLADD75 pKa = 3.73GEE77 pKa = 4.5ITDD80 pKa = 3.85AEE82 pKa = 4.35YY83 pKa = 11.44AEE85 pKa = 4.47MVTRR89 pKa = 11.84LSEE92 pKa = 4.22CLDD95 pKa = 3.87GYY97 pKa = 10.75GVEE100 pKa = 4.59LQSIAPGAGMSTTNAPNGADD120 pKa = 2.89THH122 pKa = 6.51EE123 pKa = 4.97IINTCSVVAGEE134 pKa = 4.19NSIGALRR141 pKa = 11.84DD142 pKa = 3.94FMADD146 pKa = 3.25NPDD149 pKa = 3.73NADD152 pKa = 3.58PTPLIVQCLVDD163 pKa = 4.09SGTVPSDD170 pKa = 3.38YY171 pKa = 10.94GVEE174 pKa = 4.57DD175 pKa = 5.03FDD177 pKa = 4.69TDD179 pKa = 3.7SQSRR183 pKa = 11.84FTDD186 pKa = 3.79LDD188 pKa = 3.32QLDD191 pKa = 4.69PGLSAAFTSCTMDD204 pKa = 3.11VSRR207 pKa = 11.84SMTADD212 pKa = 3.26ASRR215 pKa = 4.06
MM1 pKa = 7.55IGGAPGRR8 pKa = 11.84WGGALLLVVLAVLTSACGGHH28 pKa = 6.74AAATEE33 pKa = 4.13SSNAEE38 pKa = 3.76SVAFSGEE45 pKa = 4.06VPEE48 pKa = 5.42FEE50 pKa = 4.37GPYY53 pKa = 9.85AAEE56 pKa = 3.81FADD59 pKa = 5.12FYY61 pKa = 11.26VHH63 pKa = 5.92STSEE67 pKa = 3.82FVRR70 pKa = 11.84AVLADD75 pKa = 3.73GEE77 pKa = 4.5ITDD80 pKa = 3.85AEE82 pKa = 4.35YY83 pKa = 11.44AEE85 pKa = 4.47MVTRR89 pKa = 11.84LSEE92 pKa = 4.22CLDD95 pKa = 3.87GYY97 pKa = 10.75GVEE100 pKa = 4.59LQSIAPGAGMSTTNAPNGADD120 pKa = 2.89THH122 pKa = 6.51EE123 pKa = 4.97IINTCSVVAGEE134 pKa = 4.19NSIGALRR141 pKa = 11.84DD142 pKa = 3.94FMADD146 pKa = 3.25NPDD149 pKa = 3.73NADD152 pKa = 3.58PTPLIVQCLVDD163 pKa = 4.09SGTVPSDD170 pKa = 3.38YY171 pKa = 10.94GVEE174 pKa = 4.57DD175 pKa = 5.03FDD177 pKa = 4.69TDD179 pKa = 3.7SQSRR183 pKa = 11.84FTDD186 pKa = 3.79LDD188 pKa = 3.32QLDD191 pKa = 4.69PGLSAAFTSCTMDD204 pKa = 3.11VSRR207 pKa = 11.84SMTADD212 pKa = 3.26ASRR215 pKa = 4.06
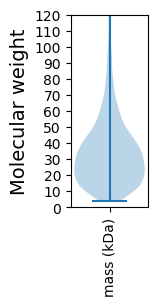
Molecular weight: 22.31 kDa
Isoelectric point according different methods:
Protein with the highest isoelectric point:
>tr|A0A511JDR3|A0A511JDR3_9CELL Uncharacterized protein OS=Cellulomonas composti OX=266130 GN=CCO02nite_27700 PE=4 SV=1
MM1 pKa = 7.69SKK3 pKa = 9.0RR4 pKa = 11.84TFQPNNRR11 pKa = 11.84RR12 pKa = 11.84RR13 pKa = 11.84AKK15 pKa = 8.7THH17 pKa = 5.15GFRR20 pKa = 11.84LRR22 pKa = 11.84MRR24 pKa = 11.84TRR26 pKa = 11.84AGRR29 pKa = 11.84SILAARR35 pKa = 11.84RR36 pKa = 11.84RR37 pKa = 11.84KK38 pKa = 9.61GRR40 pKa = 11.84AEE42 pKa = 3.84LSAA45 pKa = 4.93
MM1 pKa = 7.69SKK3 pKa = 9.0RR4 pKa = 11.84TFQPNNRR11 pKa = 11.84RR12 pKa = 11.84RR13 pKa = 11.84AKK15 pKa = 8.7THH17 pKa = 5.15GFRR20 pKa = 11.84LRR22 pKa = 11.84MRR24 pKa = 11.84TRR26 pKa = 11.84AGRR29 pKa = 11.84SILAARR35 pKa = 11.84RR36 pKa = 11.84RR37 pKa = 11.84KK38 pKa = 9.61GRR40 pKa = 11.84AEE42 pKa = 3.84LSAA45 pKa = 4.93
Molecular weight: 5.32 kDa
Isoelectric point according different methods:
Peptides (in silico digests for buttom-up proteomics)
Below you can find in silico digests of the whole proteome with Trypsin, Chymotrypsin, Trypsin+LysC, LysN, ArgC proteases suitable for different mass spec machines.| Try ESI |
 |
|---|
| ChTry ESI |
|
|---|
| ArgC ESI |
|
|---|
| LysN ESI |
|
|---|
| TryLysC ESI |
|
|---|
| Try MALDI |
|
|---|
| ChTry MALDI |
|
|---|
| ArgC MALDI |
|
|---|
| LysN MALDI |
|
|---|
| TryLysC MALDI |
|
|---|
| Try LTQ |
|
|---|
| ChTry LTQ |
|
|---|
| ArgC LTQ |
|
|---|
| LysN LTQ |
|
|---|
| TryLysC LTQ |
|
|---|
| Try MSlow |
|
|---|
| ChTry MSlow |
|
|---|
| ArgC MSlow |
|
|---|
| LysN MSlow |
|
|---|
| TryLysC MSlow |
|
|---|
| Try MShigh |
|
|---|
| ChTry MShigh |
|
|---|
| ArgC MShigh |
|
|---|
| LysN MShigh |
|
|---|
| TryLysC MShigh |
|
|---|
General Statistics
Number of major isoforms |
Number of additional isoforms |
Number of all proteins |
Number of amino acids |
Min. Seq. Length |
Max. Seq. Length |
Avg. Seq. Length |
Avg. Mol. Weight |
|---|---|---|---|---|---|---|---|
0 |
1071251 |
39 |
3147 |
344.3 |
36.5 |
Amino acid frequency
Ala |
Cys |
Asp |
Glu |
Phe |
Gly |
His |
Ile |
Lys |
Leu |
|---|---|---|---|---|---|---|---|---|---|
14.323 ± 0.065 | 0.584 ± 0.011 |
6.665 ± 0.03 | 5.226 ± 0.041 |
2.509 ± 0.022 | 9.234 ± 0.04 |
2.061 ± 0.022 | 2.983 ± 0.031 |
1.489 ± 0.03 | 10.153 ± 0.057 |
Met |
Asn |
Gln |
Pro |
Arg |
Ser |
Thr |
Val |
Trp |
Tyr |
|---|---|---|---|---|---|---|---|---|---|
1.496 ± 0.017 | 1.524 ± 0.024 |
5.977 ± 0.039 | 2.665 ± 0.024 |
7.72 ± 0.056 | 5.119 ± 0.034 |
6.59 ± 0.064 | 10.282 ± 0.046 |
1.564 ± 0.019 | 1.835 ± 0.021 |
Most of the basic statistics you can see at this page can be downloaded from this CSV file
See this proteome in:

Proteome-pI is available under Creative Commons Attribution-NoDerivs license, for more details see here
| Reference: Kozlowski LP. Proteome-pI 2.0: Proteome Isoelectric Point Database Update. Nucleic Acids Res. 2021, doi: 10.1093/nar/gkab944 | Contact: Lukasz P. Kozlowski |