Faecalibacterium prausnitzii
Taxonomy: cellular organisms; Bacteria; Terrabacteria group; Firmicutes; Clostridia; Eubacteriales; Oscillospiraceae; Faecalibacterium
Average proteome isoelectric point is 6.11
Get precalculated fractions of proteins
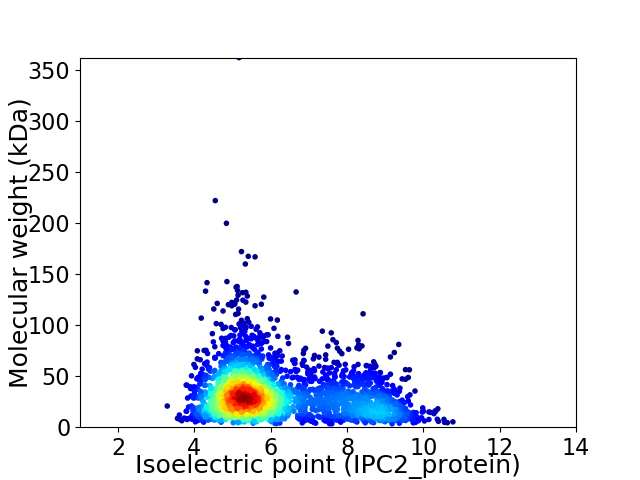
Virtual 2D-PAGE plot for 2653 proteins (isoelectric point calculated using IPC2_protein)
Get csv file with sequences according to given criteria:
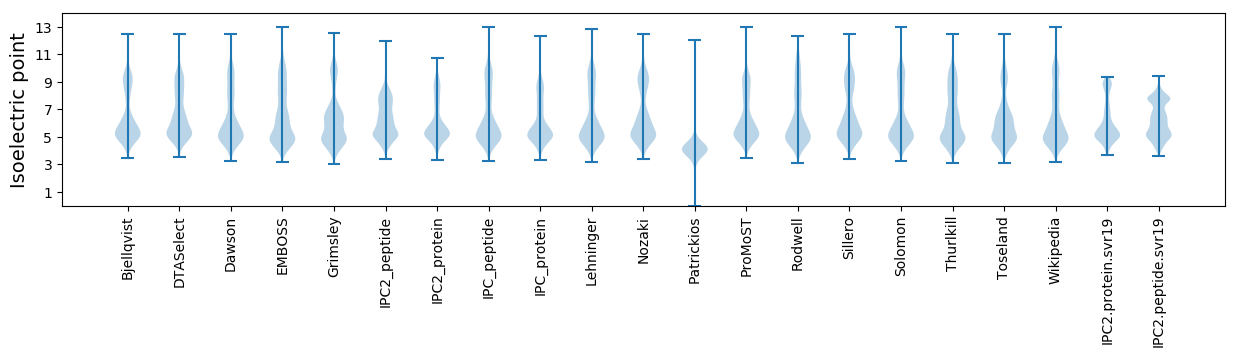
* You can choose from 21 different methods for calculating isoelectric point
Summary statistics related to proteome-wise predictions
Protein with the lowest isoelectric point:
>tr|A0A173XAR1|A0A173XAR1_9FIRM ATP phosphoribosyltransferase OS=Faecalibacterium prausnitzii OX=853 GN=hisG PE=3 SV=1
MM1 pKa = 7.33KK2 pKa = 10.0FWKK5 pKa = 8.97RR6 pKa = 11.84TALCLALCAALLAGCTPARR25 pKa = 11.84DD26 pKa = 3.78AAEE29 pKa = 4.43SDD31 pKa = 3.9TPADD35 pKa = 3.75PLTGQEE41 pKa = 4.65LLWPGQRR48 pKa = 11.84PVAVTIEE55 pKa = 4.27NDD57 pKa = 3.57PSSTTQWGLSTASVVLQALTEE78 pKa = 4.4TQTPTSLCLVYY89 pKa = 9.89PAVDD93 pKa = 3.48AVPQVGPVSAGQDD106 pKa = 3.71LYY108 pKa = 10.94WRR110 pKa = 11.84LLVGQQVLPVQRR122 pKa = 11.84GGGAFDD128 pKa = 3.77QNYY131 pKa = 10.12LDD133 pKa = 4.29YY134 pKa = 11.26YY135 pKa = 9.13SLRR138 pKa = 11.84VVDD141 pKa = 4.86ALEE144 pKa = 4.28TGTNAFSCDD153 pKa = 3.86GAWSNSPLWYY163 pKa = 9.58TSGSALAGVLGKK175 pKa = 10.84LNISSVLTEE184 pKa = 4.3SRR186 pKa = 11.84LTDD189 pKa = 3.44AAASGTSEE197 pKa = 4.55SEE199 pKa = 4.14TEE201 pKa = 4.18TTVLSVPALLPQQTKK216 pKa = 9.71GHH218 pKa = 6.69LPDD221 pKa = 4.61AAASDD226 pKa = 3.92AVSVRR231 pKa = 11.84VQFDD235 pKa = 3.08ASNATGFSYY244 pKa = 11.04DD245 pKa = 4.35ADD247 pKa = 3.59SSTYY251 pKa = 11.2KK252 pKa = 9.8MLHH255 pKa = 6.79ADD257 pKa = 3.94GTPQLDD263 pKa = 3.79ANNGQQAGFDD273 pKa = 3.54NLLVLFSASALRR285 pKa = 11.84DD286 pKa = 3.61DD287 pKa = 5.71GLTLDD292 pKa = 4.48YY293 pKa = 10.81DD294 pKa = 3.78LTMGGGVWLNGGHH307 pKa = 7.62LWPITWTQGSDD318 pKa = 3.17TTFFFYY324 pKa = 10.82DD325 pKa = 3.73ADD327 pKa = 4.13GQPLTLTAGSSYY339 pKa = 10.38IALVSSLTGQEE350 pKa = 4.15LMVLNSAGEE359 pKa = 4.33SLTPALATEE368 pKa = 4.69ADD370 pKa = 3.87SASINPP376 pKa = 3.84
MM1 pKa = 7.33KK2 pKa = 10.0FWKK5 pKa = 8.97RR6 pKa = 11.84TALCLALCAALLAGCTPARR25 pKa = 11.84DD26 pKa = 3.78AAEE29 pKa = 4.43SDD31 pKa = 3.9TPADD35 pKa = 3.75PLTGQEE41 pKa = 4.65LLWPGQRR48 pKa = 11.84PVAVTIEE55 pKa = 4.27NDD57 pKa = 3.57PSSTTQWGLSTASVVLQALTEE78 pKa = 4.4TQTPTSLCLVYY89 pKa = 9.89PAVDD93 pKa = 3.48AVPQVGPVSAGQDD106 pKa = 3.71LYY108 pKa = 10.94WRR110 pKa = 11.84LLVGQQVLPVQRR122 pKa = 11.84GGGAFDD128 pKa = 3.77QNYY131 pKa = 10.12LDD133 pKa = 4.29YY134 pKa = 11.26YY135 pKa = 9.13SLRR138 pKa = 11.84VVDD141 pKa = 4.86ALEE144 pKa = 4.28TGTNAFSCDD153 pKa = 3.86GAWSNSPLWYY163 pKa = 9.58TSGSALAGVLGKK175 pKa = 10.84LNISSVLTEE184 pKa = 4.3SRR186 pKa = 11.84LTDD189 pKa = 3.44AAASGTSEE197 pKa = 4.55SEE199 pKa = 4.14TEE201 pKa = 4.18TTVLSVPALLPQQTKK216 pKa = 9.71GHH218 pKa = 6.69LPDD221 pKa = 4.61AAASDD226 pKa = 3.92AVSVRR231 pKa = 11.84VQFDD235 pKa = 3.08ASNATGFSYY244 pKa = 11.04DD245 pKa = 4.35ADD247 pKa = 3.59SSTYY251 pKa = 11.2KK252 pKa = 9.8MLHH255 pKa = 6.79ADD257 pKa = 3.94GTPQLDD263 pKa = 3.79ANNGQQAGFDD273 pKa = 3.54NLLVLFSASALRR285 pKa = 11.84DD286 pKa = 3.61DD287 pKa = 5.71GLTLDD292 pKa = 4.48YY293 pKa = 10.81DD294 pKa = 3.78LTMGGGVWLNGGHH307 pKa = 7.62LWPITWTQGSDD318 pKa = 3.17TTFFFYY324 pKa = 10.82DD325 pKa = 3.73ADD327 pKa = 4.13GQPLTLTAGSSYY339 pKa = 10.38IALVSSLTGQEE350 pKa = 4.15LMVLNSAGEE359 pKa = 4.33SLTPALATEE368 pKa = 4.69ADD370 pKa = 3.87SASINPP376 pKa = 3.84
Molecular weight: 39.46 kDa
Isoelectric point according different methods:
Protein with the highest isoelectric point:
>tr|A0A173XXL3|A0A173XXL3_9FIRM Ribosomal large subunit pseudouridine synthase D OS=Faecalibacterium prausnitzii OX=853 GN=rluD_2 PE=4 SV=1
MM1 pKa = 7.45KK2 pKa = 9.6RR3 pKa = 11.84TFQPKK8 pKa = 8.47KK9 pKa = 7.63RR10 pKa = 11.84QRR12 pKa = 11.84KK13 pKa = 7.09EE14 pKa = 3.35VHH16 pKa = 5.99GFLTRR21 pKa = 11.84MSTKK25 pKa = 10.35NGRR28 pKa = 11.84KK29 pKa = 9.33VINARR34 pKa = 11.84RR35 pKa = 11.84AKK37 pKa = 9.76GRR39 pKa = 11.84KK40 pKa = 8.97SLTVV44 pKa = 3.12
MM1 pKa = 7.45KK2 pKa = 9.6RR3 pKa = 11.84TFQPKK8 pKa = 8.47KK9 pKa = 7.63RR10 pKa = 11.84QRR12 pKa = 11.84KK13 pKa = 7.09EE14 pKa = 3.35VHH16 pKa = 5.99GFLTRR21 pKa = 11.84MSTKK25 pKa = 10.35NGRR28 pKa = 11.84KK29 pKa = 9.33VINARR34 pKa = 11.84RR35 pKa = 11.84AKK37 pKa = 9.76GRR39 pKa = 11.84KK40 pKa = 8.97SLTVV44 pKa = 3.12
Molecular weight: 5.23 kDa
Isoelectric point according different methods:
Peptides (in silico digests for buttom-up proteomics)
Below you can find in silico digests of the whole proteome with Trypsin, Chymotrypsin, Trypsin+LysC, LysN, ArgC proteases suitable for different mass spec machines.| Try ESI |
 |
|---|
| ChTry ESI |
|
|---|
| ArgC ESI |
|
|---|
| LysN ESI |
|
|---|
| TryLysC ESI |
|
|---|
| Try MALDI |
|
|---|
| ChTry MALDI |
|
|---|
| ArgC MALDI |
|
|---|
| LysN MALDI |
|
|---|
| TryLysC MALDI |
|
|---|
| Try LTQ |
|
|---|
| ChTry LTQ |
|
|---|
| ArgC LTQ |
|
|---|
| LysN LTQ |
|
|---|
| TryLysC LTQ |
|
|---|
| Try MSlow |
|
|---|
| ChTry MSlow |
|
|---|
| ArgC MSlow |
|
|---|
| LysN MSlow |
|
|---|
| TryLysC MSlow |
|
|---|
| Try MShigh |
|
|---|
| ChTry MShigh |
|
|---|
| ArgC MShigh |
|
|---|
| LysN MShigh |
|
|---|
| TryLysC MShigh |
|
|---|
General Statistics
Number of major isoforms |
Number of additional isoforms |
Number of all proteins |
Number of amino acids |
Min. Seq. Length |
Max. Seq. Length |
Avg. Seq. Length |
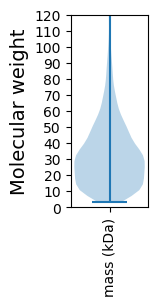
Avg. Mol. Weight |
|---|---|---|---|---|---|---|---|
0 |
826170 |
29 |
3304 |
311.4 |
34.41 |
Amino acid frequency
Ala |
Cys |
Asp |
Glu |
Phe |
Gly |
His |
Ile |
Lys |
Leu |
|---|---|---|---|---|---|---|---|---|---|
10.043 ± 0.07 | 1.7 ± 0.019 |
5.567 ± 0.039 | 6.77 ± 0.052 |
3.803 ± 0.035 | 7.445 ± 0.047 |
1.887 ± 0.023 | 5.426 ± 0.045 |
5.426 ± 0.046 | 9.862 ± 0.061 |
Met |
Asn |
Gln |
Pro |
Arg |
Ser |
Thr |
Val |
Trp |
Tyr |
|---|---|---|---|---|---|---|---|---|---|
2.769 ± 0.025 | 3.66 ± 0.028 |
4.089 ± 0.03 | 3.584 ± 0.031 |
5.177 ± 0.047 | 5.453 ± 0.04 |
5.676 ± 0.037 | 7.034 ± 0.042 |
1.05 ± 0.018 | 3.58 ± 0.033 |
Most of the basic statistics you can see at this page can be downloaded from this CSV file
See this proteome in:

Proteome-pI is available under Creative Commons Attribution-NoDerivs license, for more details see here
| Reference: Kozlowski LP. Proteome-pI 2.0: Proteome Isoelectric Point Database Update. Nucleic Acids Res. 2021, doi: 10.1093/nar/gkab944 | Contact: Lukasz P. Kozlowski |