Geoglobus ahangari
Taxonomy: cellular organisms; Archaea; Euryarchaeota; Archaeoglobi; Archaeoglobales; Archaeoglobaceae; Geoglobus
Average proteome isoelectric point is 6.24
Get precalculated fractions of proteins
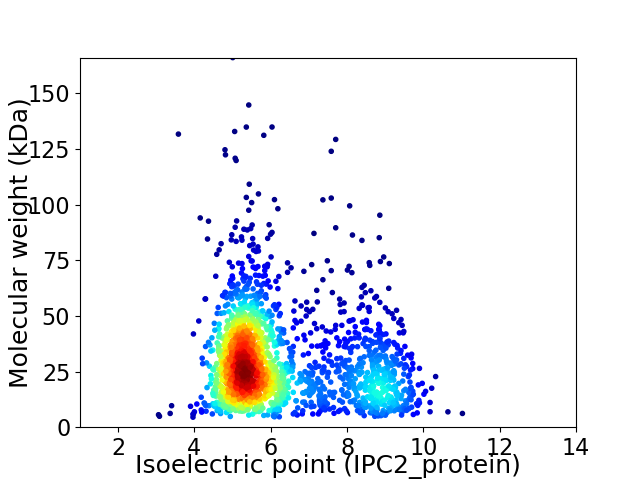
Virtual 2D-PAGE plot for 1973 proteins (isoelectric point calculated using IPC2_protein)
Get csv file with sequences according to given criteria:
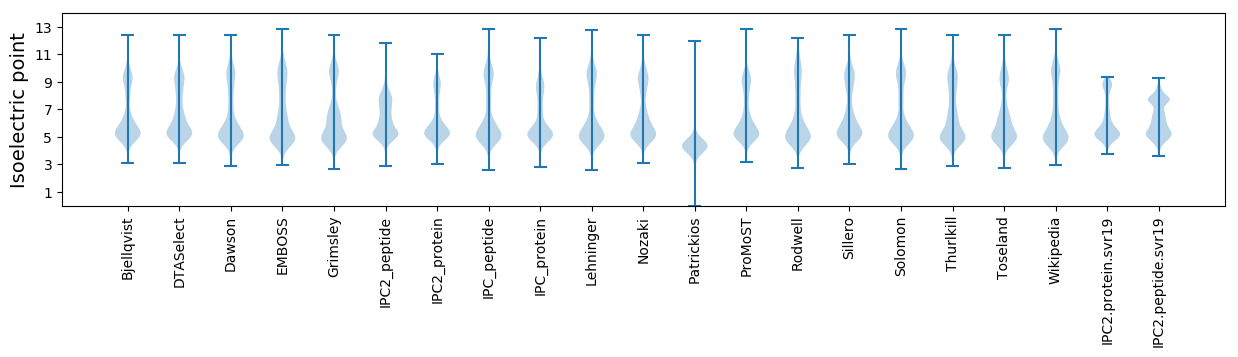
* You can choose from 21 different methods for calculating isoelectric point
Summary statistics related to proteome-wise predictions
Protein with the lowest isoelectric point:
>tr|A0A0F7DBG7|A0A0F7DBG7_9EURY Uncharacterized protein OS=Geoglobus ahangari OX=113653 GN=GAH_01653 PE=4 SV=1
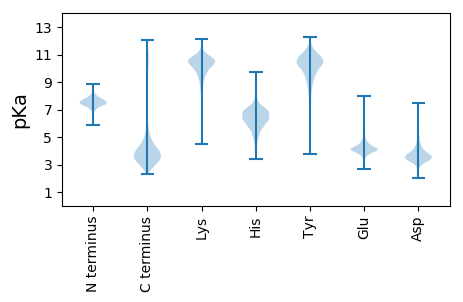
MM1 pKa = 7.79AKK3 pKa = 9.79YY4 pKa = 9.07QCKK7 pKa = 9.09VCGYY11 pKa = 10.22VYY13 pKa = 10.75DD14 pKa = 4.28EE15 pKa = 5.8AEE17 pKa = 4.39GDD19 pKa = 3.82PDD21 pKa = 3.67NDD23 pKa = 3.28IPAGTKK29 pKa = 9.36WEE31 pKa = 4.7DD32 pKa = 3.58LPEE35 pKa = 4.73DD36 pKa = 3.99WVCPVCGASKK46 pKa = 10.89EE47 pKa = 4.06DD48 pKa = 3.82FEE50 pKa = 6.28KK51 pKa = 10.73IEE53 pKa = 3.91
MM1 pKa = 7.79AKK3 pKa = 9.79YY4 pKa = 9.07QCKK7 pKa = 9.09VCGYY11 pKa = 10.22VYY13 pKa = 10.75DD14 pKa = 4.28EE15 pKa = 5.8AEE17 pKa = 4.39GDD19 pKa = 3.82PDD21 pKa = 3.67NDD23 pKa = 3.28IPAGTKK29 pKa = 9.36WEE31 pKa = 4.7DD32 pKa = 3.58LPEE35 pKa = 4.73DD36 pKa = 3.99WVCPVCGASKK46 pKa = 10.89EE47 pKa = 4.06DD48 pKa = 3.82FEE50 pKa = 6.28KK51 pKa = 10.73IEE53 pKa = 3.91
Molecular weight: 5.99 kDa
Isoelectric point according different methods:
Protein with the highest isoelectric point:
>tr|A0A0F7II16|A0A0F7II16_9EURY Uncharacterized protein OS=Geoglobus ahangari OX=113653 GN=GAH_00245 PE=4 SV=1
MM1 pKa = 7.48SVIDD5 pKa = 3.6LSGIEE10 pKa = 4.04RR11 pKa = 11.84ARR13 pKa = 11.84RR14 pKa = 11.84QYY16 pKa = 11.41VDD18 pKa = 3.25MILRR22 pKa = 11.84AEE24 pKa = 5.33FIRR27 pKa = 11.84ADD29 pKa = 4.58KK30 pKa = 10.68IPKK33 pKa = 6.96TCRR36 pKa = 11.84RR37 pKa = 11.84SKK39 pKa = 10.6CPRR42 pKa = 11.84DD43 pKa = 3.43LRR45 pKa = 11.84TT46 pKa = 3.47
MM1 pKa = 7.48SVIDD5 pKa = 3.6LSGIEE10 pKa = 4.04RR11 pKa = 11.84ARR13 pKa = 11.84RR14 pKa = 11.84QYY16 pKa = 11.41VDD18 pKa = 3.25MILRR22 pKa = 11.84AEE24 pKa = 5.33FIRR27 pKa = 11.84ADD29 pKa = 4.58KK30 pKa = 10.68IPKK33 pKa = 6.96TCRR36 pKa = 11.84RR37 pKa = 11.84SKK39 pKa = 10.6CPRR42 pKa = 11.84DD43 pKa = 3.43LRR45 pKa = 11.84TT46 pKa = 3.47
Molecular weight: 5.47 kDa
Isoelectric point according different methods:
Peptides (in silico digests for buttom-up proteomics)
Below you can find in silico digests of the whole proteome with Trypsin, Chymotrypsin, Trypsin+LysC, LysN, ArgC proteases suitable for different mass spec machines.| Try ESI |
 |
|---|
| ChTry ESI |
|
|---|
| ArgC ESI |
|
|---|
| LysN ESI |
|
|---|
| TryLysC ESI |
|
|---|
| Try MALDI |
|
|---|
| ChTry MALDI |
|
|---|
| ArgC MALDI |
|
|---|
| LysN MALDI |
|
|---|
| TryLysC MALDI |
|
|---|
| Try LTQ |
|
|---|
| ChTry LTQ |
|
|---|
| ArgC LTQ |
|
|---|
| LysN LTQ |
|
|---|
| TryLysC LTQ |
|
|---|
| Try MSlow |
|
|---|
| ChTry MSlow |
|
|---|
| ArgC MSlow |
|
|---|
| LysN MSlow |
|
|---|
| TryLysC MSlow |
|
|---|
| Try MShigh |
|
|---|
| ChTry MShigh |
|
|---|
| ArgC MShigh |
|
|---|
| LysN MShigh |
|
|---|
| TryLysC MShigh |
|
|---|
General Statistics
Number of major isoforms |
Number of additional isoforms |
Number of all proteins |
Number of amino acids |
Min. Seq. Length |
Max. Seq. Length |
Avg. Seq. Length |
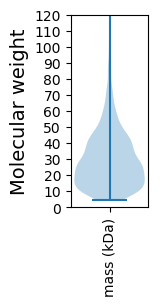
Avg. Mol. Weight |
|---|---|---|---|---|---|---|---|
0 |
540133 |
39 |
1541 |
273.8 |
30.79 |
Amino acid frequency
Ala |
Cys |
Asp |
Glu |
Phe |
Gly |
His |
Ile |
Lys |
Leu |
|---|---|---|---|---|---|---|---|---|---|
7.421 ± 0.059 | 0.978 ± 0.029 |
5.129 ± 0.042 | 8.964 ± 0.078 |
4.411 ± 0.043 | 7.444 ± 0.058 |
1.67 ± 0.025 | 7.187 ± 0.045 |
5.935 ± 0.061 | 9.311 ± 0.072 |
Met |
Asn |
Gln |
Pro |
Arg |
Ser |
Thr |
Val |
Trp |
Tyr |
|---|---|---|---|---|---|---|---|---|---|
2.653 ± 0.025 | 3.067 ± 0.04 |
3.793 ± 0.038 | 1.661 ± 0.026 |
6.701 ± 0.071 | 5.795 ± 0.051 |
4.18 ± 0.047 | 9.017 ± 0.052 |
0.965 ± 0.023 | 3.716 ± 0.032 |
Most of the basic statistics you can see at this page can be downloaded from this CSV file
See this proteome in:

Proteome-pI is available under Creative Commons Attribution-NoDerivs license, for more details see here
| Reference: Kozlowski LP. Proteome-pI 2.0: Proteome Isoelectric Point Database Update. Nucleic Acids Res. 2021, doi: 10.1093/nar/gkab944 | Contact: Lukasz P. Kozlowski |