Penicillium rubens (strain ATCC 28089 / DSM 1075 / NRRL 1951 / Wisconsin 54-1255) (Penicillium chrysogenum)
Taxonomy: cellular organisms; Eukaryota; Opisthokonta; Fungi; Dikarya; Ascomycota; saccharomyceta; Pezizomycotina; leotiomyceta; Eurotiomycetes; Eurotiomycetidae; Eurotiales; Aspergillaceae; Penicillium; Penicillium chrysogenum species complex; Penicillium rubens
Average proteome isoelectric point is 6.56
Get precalculated fractions of proteins

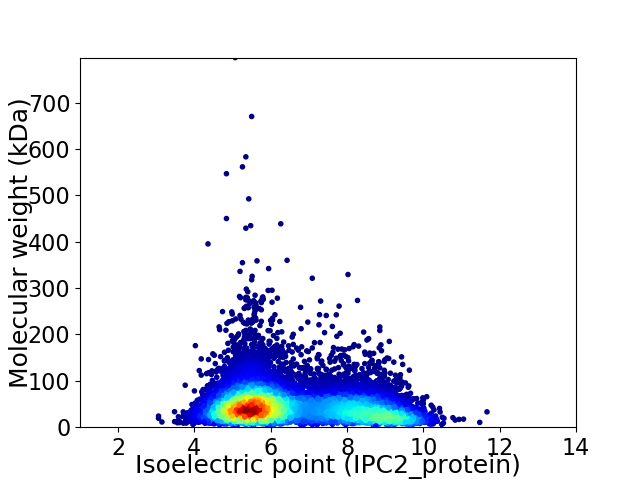
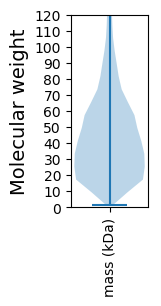
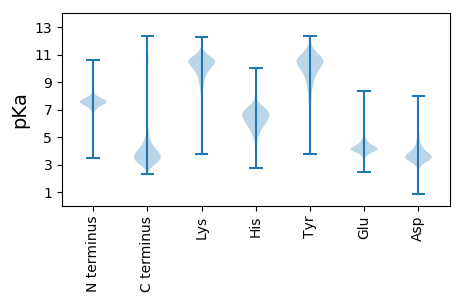
Virtual 2D-PAGE plot for 12788 proteins (isoelectric point calculated using IPC2_protein)
Get csv file with sequences according to given criteria:
* You can choose from 21 different methods for calculating isoelectric point
Summary statistics related to proteome-wise predictions


Protein with the lowest isoelectric point:
>tr|B6HIF0|B6HIF0_PENRW Pc21g05930 protein OS=Penicillium rubens (strain ATCC 28089 / DSM 1075 / NRRL 1951 / Wisconsin 54-1255) OX=500485 GN=Pc21g05930 PE=4 SV=1
MM1 pKa = 7.72RR2 pKa = 11.84TQQLLPLCGLLLASVTIASKK22 pKa = 10.73LDD24 pKa = 3.55HH25 pKa = 7.68DD26 pKa = 5.06DD27 pKa = 3.5VPNRR31 pKa = 11.84CWPACGPVVGIANSCDD47 pKa = 3.12ARR49 pKa = 11.84HH50 pKa = 5.93EE51 pKa = 4.22RR52 pKa = 11.84DD53 pKa = 3.38SAEE56 pKa = 4.0IQCICDD62 pKa = 2.94WDD64 pKa = 3.85AAKK67 pKa = 8.95TQIPLCAACITQYY80 pKa = 9.23QTDD83 pKa = 3.5RR84 pKa = 11.84RR85 pKa = 11.84NNNTTRR91 pKa = 11.84HH92 pKa = 5.9DD93 pKa = 3.83HH94 pKa = 7.79DD95 pKa = 6.81DD96 pKa = 5.18DD97 pKa = 6.24DD98 pKa = 5.94DD99 pKa = 6.61HH100 pKa = 9.43DD101 pKa = 5.85DD102 pKa = 5.18DD103 pKa = 6.81HH104 pKa = 9.36DD105 pKa = 5.32DD106 pKa = 5.16DD107 pKa = 6.69HH108 pKa = 9.19DD109 pKa = 5.43DD110 pKa = 3.63DD111 pKa = 5.78HH112 pKa = 9.6DD113 pKa = 4.46YY114 pKa = 11.71DD115 pKa = 4.63RR116 pKa = 11.84DD117 pKa = 3.68NDD119 pKa = 3.67NDD121 pKa = 4.15IDD123 pKa = 5.4DD124 pKa = 5.56DD125 pKa = 4.89DD126 pKa = 6.11NEE128 pKa = 4.39ALDD131 pKa = 3.67LVRR134 pKa = 11.84YY135 pKa = 9.23CKK137 pKa = 9.98LTTTTYY143 pKa = 10.94NSAAATTMGTSTSTAGANTATTTDD167 pKa = 3.76PSNAATGTDD176 pKa = 3.38SAGTGGTNSQDD187 pKa = 3.5STDD190 pKa = 3.7SAGASAGSASSPTPTPDD207 pKa = 2.9AAAGILAPGAASMAGVMGIMALAWLL232 pKa = 4.4
MM1 pKa = 7.72RR2 pKa = 11.84TQQLLPLCGLLLASVTIASKK22 pKa = 10.73LDD24 pKa = 3.55HH25 pKa = 7.68DD26 pKa = 5.06DD27 pKa = 3.5VPNRR31 pKa = 11.84CWPACGPVVGIANSCDD47 pKa = 3.12ARR49 pKa = 11.84HH50 pKa = 5.93EE51 pKa = 4.22RR52 pKa = 11.84DD53 pKa = 3.38SAEE56 pKa = 4.0IQCICDD62 pKa = 2.94WDD64 pKa = 3.85AAKK67 pKa = 8.95TQIPLCAACITQYY80 pKa = 9.23QTDD83 pKa = 3.5RR84 pKa = 11.84RR85 pKa = 11.84NNNTTRR91 pKa = 11.84HH92 pKa = 5.9DD93 pKa = 3.83HH94 pKa = 7.79DD95 pKa = 6.81DD96 pKa = 5.18DD97 pKa = 6.24DD98 pKa = 5.94DD99 pKa = 6.61HH100 pKa = 9.43DD101 pKa = 5.85DD102 pKa = 5.18DD103 pKa = 6.81HH104 pKa = 9.36DD105 pKa = 5.32DD106 pKa = 5.16DD107 pKa = 6.69HH108 pKa = 9.19DD109 pKa = 5.43DD110 pKa = 3.63DD111 pKa = 5.78HH112 pKa = 9.6DD113 pKa = 4.46YY114 pKa = 11.71DD115 pKa = 4.63RR116 pKa = 11.84DD117 pKa = 3.68NDD119 pKa = 3.67NDD121 pKa = 4.15IDD123 pKa = 5.4DD124 pKa = 5.56DD125 pKa = 4.89DD126 pKa = 6.11NEE128 pKa = 4.39ALDD131 pKa = 3.67LVRR134 pKa = 11.84YY135 pKa = 9.23CKK137 pKa = 9.98LTTTTYY143 pKa = 10.94NSAAATTMGTSTSTAGANTATTTDD167 pKa = 3.76PSNAATGTDD176 pKa = 3.38SAGTGGTNSQDD187 pKa = 3.5STDD190 pKa = 3.7SAGASAGSASSPTPTPDD207 pKa = 2.9AAAGILAPGAASMAGVMGIMALAWLL232 pKa = 4.4
Molecular weight: 24.31 kDa
Isoelectric point according different methods:
Protein with the highest isoelectric point:
>tr|B6GWN6|B6GWN6_PENRW Uncharacterized protein (Fragment) OS=Penicillium rubens (strain ATCC 28089 / DSM 1075 / NRRL 1951 / Wisconsin 54-1255) OX=500485 GN=Pc11g00010 PE=4 SV=1
AA1 pKa = 7.57LRR3 pKa = 11.84PTTVSRR9 pKa = 11.84RR10 pKa = 11.84IGSASTTVSRR20 pKa = 11.84RR21 pKa = 11.84TGSASTTVSRR31 pKa = 11.84RR32 pKa = 11.84IGSAISTVSRR42 pKa = 11.84RR43 pKa = 11.84IGSASTTVSRR53 pKa = 11.84RR54 pKa = 11.84TGSASTTVSRR64 pKa = 11.84RR65 pKa = 11.84IGSASTTVSRR75 pKa = 11.84RR76 pKa = 11.84IGSASTTVSRR86 pKa = 11.84RR87 pKa = 11.84TGSASTTVSRR97 pKa = 11.84RR98 pKa = 11.84TGSAA102 pKa = 2.77
AA1 pKa = 7.57LRR3 pKa = 11.84PTTVSRR9 pKa = 11.84RR10 pKa = 11.84IGSASTTVSRR20 pKa = 11.84RR21 pKa = 11.84TGSASTTVSRR31 pKa = 11.84RR32 pKa = 11.84IGSAISTVSRR42 pKa = 11.84RR43 pKa = 11.84IGSASTTVSRR53 pKa = 11.84RR54 pKa = 11.84TGSASTTVSRR64 pKa = 11.84RR65 pKa = 11.84IGSASTTVSRR75 pKa = 11.84RR76 pKa = 11.84IGSASTTVSRR86 pKa = 11.84RR87 pKa = 11.84TGSASTTVSRR97 pKa = 11.84RR98 pKa = 11.84TGSAA102 pKa = 2.77
Molecular weight: 10.38 kDa
Isoelectric point according different methods:
Peptides (in silico digests for buttom-up proteomics)
Below you can find in silico digests of the whole proteome with Trypsin, Chymotrypsin, Trypsin+LysC, LysN, ArgC proteases suitable for different mass spec machines.| Try ESI |
 |
|---|
| ChTry ESI |
 |
|---|
| ArgC ESI |
 |
|---|
| LysN ESI |
 |
|---|
| TryLysC ESI |
 |
|---|
| Try MALDI |
 |
|---|
| ChTry MALDI |
 |
|---|
| ArgC MALDI |
 |
|---|
| LysN MALDI |
 |
|---|
| TryLysC MALDI |
 |
|---|
| Try LTQ |
 |
|---|
| ChTry LTQ |
 |
|---|
| ArgC LTQ |
 |
|---|
| LysN LTQ |
 |
|---|
| TryLysC LTQ |
 |
|---|
| Try MSlow |
 |
|---|
| ChTry MSlow |
 |
|---|
| ArgC MSlow |
 |
|---|
| LysN MSlow |
 |
|---|
| TryLysC MSlow |
 |
|---|
| Try MShigh |
 |
|---|
| ChTry MShigh |
 |
|---|
| ArgC MShigh |
 |
|---|
| LysN MShigh |
 |
|---|
| TryLysC MShigh |
 |
|---|
General Statistics
Number of major isoforms |
Number of additional isoforms |
Number of all proteins |
Number of amino acids |
Min. Seq. Length |
Max. Seq. Length |
Avg. Seq. Length |
Avg. Mol. Weight |
|---|---|---|---|---|---|---|---|
0 |
5708734 |
11 |
7287 |
446.4 |
49.49 |
Amino acid frequency
Ala |
Cys |
Asp |
Glu |
Phe |
Gly |
His |
Ile |
Lys |
Leu |
|---|---|---|---|---|---|---|---|---|---|
8.27 ± 0.02 | 1.349 ± 0.009 |
5.599 ± 0.013 | 6.05 ± 0.02 |
3.763 ± 0.012 | 6.742 ± 0.021 |
2.489 ± 0.01 | 5.069 ± 0.015 |
4.614 ± 0.019 | 9.009 ± 0.024 |
Met |
Asn |
Gln |
Pro |
Arg |
Ser |
Thr |
Val |
Trp |
Tyr |
|---|---|---|---|---|---|---|---|---|---|
2.235 ± 0.009 | 3.697 ± 0.011 |
6.095 ± 0.024 | 4.02 ± 0.015 |
6.173 ± 0.02 | 8.414 ± 0.022 |
5.931 ± 0.013 | 6.136 ± 0.021 |
1.491 ± 0.009 | 2.823 ± 0.013 |
Most of the basic statistics you can see at this page can be downloaded from this CSV file
Proteome-pI is available under Creative Commons Attribution-NoDerivs license, for more details see here
| Reference: Kozlowski LP. Proteome-pI 2.0: Proteome Isoelectric Point Database Update. Nucleic Acids Res. 2021, doi: 10.1093/nar/gkab944 | Contact: Lukasz P. Kozlowski |
