Enterobacter phage CC31
Taxonomy: Viruses; Duplodnaviria; Heunggongvirae; Uroviricota; Caudoviricetes; Caudovirales; Myoviridae; Tevenvirinae; Karamvirus; Escherichia virus CC31
Average proteome isoelectric point is 6.16
Get precalculated fractions of proteins

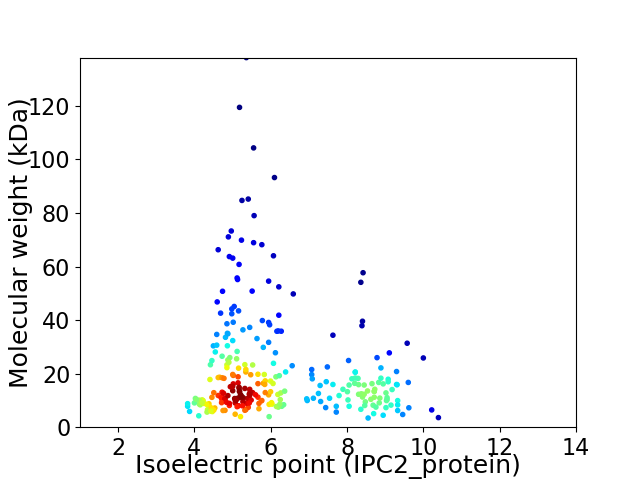
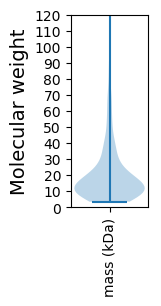
Virtual 2D-PAGE plot for 279 proteins (isoelectric point calculated using IPC2_protein)
Get csv file with sequences according to given criteria:
* You can choose from 21 different methods for calculating isoelectric point
Summary statistics related to proteome-wise predictions


Protein with the lowest isoelectric point:
>tr|E5DI84|E5DI84_9CAUD Uncharacterized protein 49.2 OS=Enterobacter phage CC31 OX=709484 GN=49.2 PE=4 SV=1
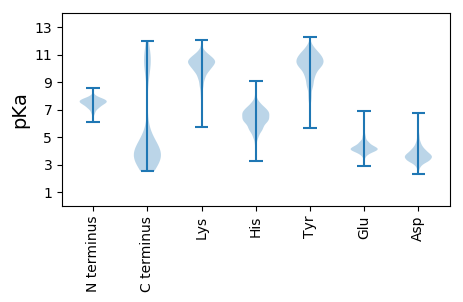
MM1 pKa = 7.71GYY3 pKa = 10.74ALKK6 pKa = 9.99PWYY9 pKa = 9.52AARR12 pKa = 11.84WEE14 pKa = 4.19TLEE17 pKa = 4.24PEE19 pKa = 4.15EE20 pKa = 4.6EE21 pKa = 4.09EE22 pKa = 5.02RR23 pKa = 11.84FPEE26 pKa = 4.81DD27 pKa = 5.18DD28 pKa = 3.76YY29 pKa = 12.26NEE31 pKa = 4.14PTNNEE36 pKa = 4.37LIDD39 pKa = 3.61MEE41 pKa = 4.62FGYY44 pKa = 10.29EE45 pKa = 3.95FPEE48 pKa = 4.14
MM1 pKa = 7.71GYY3 pKa = 10.74ALKK6 pKa = 9.99PWYY9 pKa = 9.52AARR12 pKa = 11.84WEE14 pKa = 4.19TLEE17 pKa = 4.24PEE19 pKa = 4.15EE20 pKa = 4.6EE21 pKa = 4.09EE22 pKa = 5.02RR23 pKa = 11.84FPEE26 pKa = 4.81DD27 pKa = 5.18DD28 pKa = 3.76YY29 pKa = 12.26NEE31 pKa = 4.14PTNNEE36 pKa = 4.37LIDD39 pKa = 3.61MEE41 pKa = 4.62FGYY44 pKa = 10.29EE45 pKa = 3.95FPEE48 pKa = 4.14
Molecular weight: 5.89 kDa
Isoelectric point according different methods:
Protein with the highest isoelectric point:
>tr|E5DHZ3|E5DHZ3_9CAUD Uncharacterized protein OS=Enterobacter phage CC31 OX=709484 GN=CC31p261 PE=4 SV=1
MM1 pKa = 7.78AIAGPNIGTSWFRR14 pKa = 11.84EE15 pKa = 4.01TGQRR19 pKa = 11.84PMSAARR25 pKa = 11.84VAVRR29 pKa = 11.84LPARR33 pKa = 11.84PGGARR38 pKa = 11.84QMVGLSKK45 pKa = 10.37EE46 pKa = 3.89VNYY49 pKa = 10.99NIGANNSYY57 pKa = 11.32NKK59 pKa = 9.05DD60 pKa = 3.11TLINYY65 pKa = 7.63LRR67 pKa = 11.84SQGSTPVVVTITGNLVSYY85 pKa = 10.65SSGVACLEE93 pKa = 4.37FPANLPNAYY102 pKa = 9.4VHH104 pKa = 6.77LIINGGVTLYY114 pKa = 11.1GRR116 pKa = 11.84GGNGGVKK123 pKa = 10.58GNGAAGGHH131 pKa = 7.17AINNQFGTRR140 pKa = 11.84LRR142 pKa = 11.84ITNNGAIAGGGGGGGGNSANGGMGGGGRR170 pKa = 11.84PFGYY174 pKa = 10.3ADD176 pKa = 3.51KK177 pKa = 9.51THH179 pKa = 7.14PPAAATSRR187 pKa = 11.84AATDD191 pKa = 3.62GTLTSPGIGAEE202 pKa = 4.15YY203 pKa = 10.43KK204 pKa = 10.29IGTAVQYY211 pKa = 10.17TCGSGGNVGANGGASTGRR229 pKa = 11.84LGTNYY234 pKa = 10.49GGGSAGRR241 pKa = 11.84AVIGNAPTWNKK252 pKa = 9.99VGTIYY257 pKa = 10.88GSRR260 pKa = 11.84VV261 pKa = 2.97
MM1 pKa = 7.78AIAGPNIGTSWFRR14 pKa = 11.84EE15 pKa = 4.01TGQRR19 pKa = 11.84PMSAARR25 pKa = 11.84VAVRR29 pKa = 11.84LPARR33 pKa = 11.84PGGARR38 pKa = 11.84QMVGLSKK45 pKa = 10.37EE46 pKa = 3.89VNYY49 pKa = 10.99NIGANNSYY57 pKa = 11.32NKK59 pKa = 9.05DD60 pKa = 3.11TLINYY65 pKa = 7.63LRR67 pKa = 11.84SQGSTPVVVTITGNLVSYY85 pKa = 10.65SSGVACLEE93 pKa = 4.37FPANLPNAYY102 pKa = 9.4VHH104 pKa = 6.77LIINGGVTLYY114 pKa = 11.1GRR116 pKa = 11.84GGNGGVKK123 pKa = 10.58GNGAAGGHH131 pKa = 7.17AINNQFGTRR140 pKa = 11.84LRR142 pKa = 11.84ITNNGAIAGGGGGGGGNSANGGMGGGGRR170 pKa = 11.84PFGYY174 pKa = 10.3ADD176 pKa = 3.51KK177 pKa = 9.51THH179 pKa = 7.14PPAAATSRR187 pKa = 11.84AATDD191 pKa = 3.62GTLTSPGIGAEE202 pKa = 4.15YY203 pKa = 10.43KK204 pKa = 10.29IGTAVQYY211 pKa = 10.17TCGSGGNVGANGGASTGRR229 pKa = 11.84LGTNYY234 pKa = 10.49GGGSAGRR241 pKa = 11.84AVIGNAPTWNKK252 pKa = 9.99VGTIYY257 pKa = 10.88GSRR260 pKa = 11.84VV261 pKa = 2.97
Molecular weight: 25.86 kDa
Isoelectric point according different methods:
Peptides (in silico digests for buttom-up proteomics)
Below you can find in silico digests of the whole proteome with Trypsin, Chymotrypsin, Trypsin+LysC, LysN, ArgC proteases suitable for different mass spec machines.| Try ESI |
 |
|---|
| ChTry ESI |
 |
|---|
| ArgC ESI |
 |
|---|
| LysN ESI |
 |
|---|
| TryLysC ESI |
 |
|---|
| Try MALDI |
 |
|---|
| ChTry MALDI |
 |
|---|
| ArgC MALDI |
 |
|---|
| LysN MALDI |
 |
|---|
| TryLysC MALDI |
 |
|---|
| Try LTQ |
 |
|---|
| ChTry LTQ |
 |
|---|
| ArgC LTQ |
 |
|---|
| LysN LTQ |
 |
|---|
| TryLysC LTQ |
 |
|---|
| Try MSlow |
 |
|---|
| ChTry MSlow |
 |
|---|
| ArgC MSlow |
 |
|---|
| LysN MSlow |
 |
|---|
| TryLysC MSlow |
 |
|---|
| Try MShigh |
 |
|---|
| ChTry MShigh |
 |
|---|
| ArgC MShigh |
 |
|---|
| LysN MShigh |
 |
|---|
| TryLysC MShigh |
 |
|---|
General Statistics
Number of major isoforms |
Number of additional isoforms |
Number of all proteins |
Number of amino acids |
Min. Seq. Length |
Max. Seq. Length |
Avg. Seq. Length |
Avg. Mol. Weight |
|---|---|---|---|---|---|---|---|
0 |
52490 |
31 |
1264 |
188.1 |
21.31 |
Amino acid frequency
Ala |
Cys |
Asp |
Glu |
Phe |
Gly |
His |
Ile |
Lys |
Leu |
|---|---|---|---|---|---|---|---|---|---|
7.064 ± 0.184 | 1.097 ± 0.081 |
6.207 ± 0.112 | 7.375 ± 0.175 |
4.344 ± 0.114 | 6.474 ± 0.2 |
1.846 ± 0.08 | 6.876 ± 0.107 |
7.331 ± 0.163 | 7.42 ± 0.136 |
Met |
Asn |
Gln |
Pro |
Arg |
Ser |
Thr |
Val |
Trp |
Tyr |
|---|---|---|---|---|---|---|---|---|---|
2.894 ± 0.089 | 5.26 ± 0.139 |
3.604 ± 0.089 | 3.464 ± 0.086 |
4.586 ± 0.096 | 6.001 ± 0.123 |
5.843 ± 0.193 | 6.771 ± 0.122 |
1.515 ± 0.062 | 4.029 ± 0.118 |
Most of the basic statistics you can see at this page can be downloaded from this CSV file
Proteome-pI is available under Creative Commons Attribution-NoDerivs license, for more details see here
| Reference: Kozlowski LP. Proteome-pI 2.0: Proteome Isoelectric Point Database Update. Nucleic Acids Res. 2021, doi: 10.1093/nar/gkab944 | Contact: Lukasz P. Kozlowski |
