Golovinomyces magnicellulatus
Taxonomy: cellular organisms; Eukaryota; Opisthokonta; Fungi; Dikarya; Ascomycota; saccharomyceta; Pezizomycotina; leotiomyceta; sordariomyceta; Leotiomycetes; Erysiphales; Erysiphaceae; Golovinomyces
Average proteome isoelectric point is 6.74
Get precalculated fractions of proteins

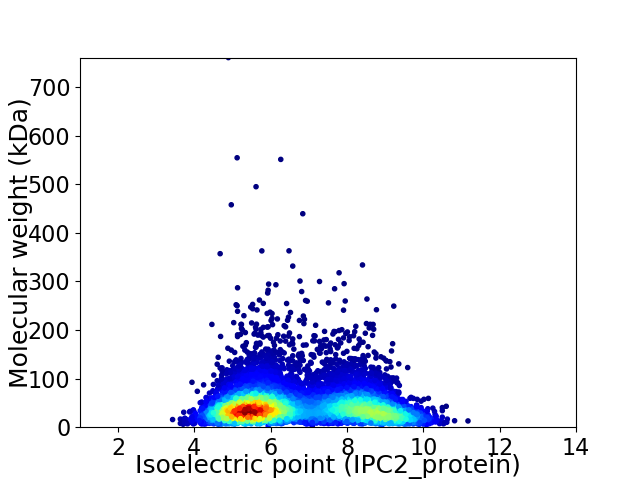
Virtual 2D-PAGE plot for 8170 proteins (isoelectric point calculated using IPC2_protein)
Get csv file with sequences according to given criteria:
* You can choose from 21 different methods for calculating isoelectric point
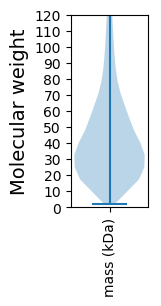
Summary statistics related to proteome-wise predictions


Protein with the lowest isoelectric point:
>tr|A0A544ZUF2|A0A544ZUF2_9PEZI WD_REPEATS_REGION domain-containing protein (Fragment) OS=Golovinomyces magnicellulatus OX=62714 GN=Golomagni_06951 PE=4 SV=1
MM1 pKa = 7.8DD2 pKa = 4.46GVMGTAPQGTMYY14 pKa = 10.34VRR16 pKa = 11.84ALYY19 pKa = 10.15DD20 pKa = 3.36YY21 pKa = 10.39EE22 pKa = 6.67ADD24 pKa = 4.05DD25 pKa = 3.81RR26 pKa = 11.84TSLSFHH32 pKa = 6.87EE33 pKa = 4.76GDD35 pKa = 3.79VIQVITQLEE44 pKa = 4.4SGWWDD49 pKa = 3.27GVINGVRR56 pKa = 11.84GWFPSNYY63 pKa = 8.13CQIVGGPDD71 pKa = 3.73DD72 pKa = 5.96LPDD75 pKa = 4.28HH76 pKa = 6.63LQQGQYY82 pKa = 11.26DD83 pKa = 4.36HH84 pKa = 7.39IDD86 pKa = 3.85DD87 pKa = 4.21EE88 pKa = 5.22NEE90 pKa = 3.91DD91 pKa = 3.6GEE93 pKa = 5.37AYY95 pKa = 10.32DD96 pKa = 3.72EE97 pKa = 4.3SFEE100 pKa = 4.72RR101 pKa = 11.84EE102 pKa = 4.13EE103 pKa = 4.76EE104 pKa = 4.13SDD106 pKa = 3.8DD107 pKa = 4.1DD108 pKa = 4.36APSRR112 pKa = 11.84LPLEE116 pKa = 4.6GTTAMGGGGGNSRR129 pKa = 11.84ADD131 pKa = 3.26FWIPQATPDD140 pKa = 4.26GRR142 pKa = 11.84LFYY145 pKa = 10.76YY146 pKa = 11.39NMMTGDD152 pKa = 3.84RR153 pKa = 11.84SMEE156 pKa = 4.15LPLEE160 pKa = 4.58SPTT163 pKa = 4.26
MM1 pKa = 7.8DD2 pKa = 4.46GVMGTAPQGTMYY14 pKa = 10.34VRR16 pKa = 11.84ALYY19 pKa = 10.15DD20 pKa = 3.36YY21 pKa = 10.39EE22 pKa = 6.67ADD24 pKa = 4.05DD25 pKa = 3.81RR26 pKa = 11.84TSLSFHH32 pKa = 6.87EE33 pKa = 4.76GDD35 pKa = 3.79VIQVITQLEE44 pKa = 4.4SGWWDD49 pKa = 3.27GVINGVRR56 pKa = 11.84GWFPSNYY63 pKa = 8.13CQIVGGPDD71 pKa = 3.73DD72 pKa = 5.96LPDD75 pKa = 4.28HH76 pKa = 6.63LQQGQYY82 pKa = 11.26DD83 pKa = 4.36HH84 pKa = 7.39IDD86 pKa = 3.85DD87 pKa = 4.21EE88 pKa = 5.22NEE90 pKa = 3.91DD91 pKa = 3.6GEE93 pKa = 5.37AYY95 pKa = 10.32DD96 pKa = 3.72EE97 pKa = 4.3SFEE100 pKa = 4.72RR101 pKa = 11.84EE102 pKa = 4.13EE103 pKa = 4.76EE104 pKa = 4.13SDD106 pKa = 3.8DD107 pKa = 4.1DD108 pKa = 4.36APSRR112 pKa = 11.84LPLEE116 pKa = 4.6GTTAMGGGGGNSRR129 pKa = 11.84ADD131 pKa = 3.26FWIPQATPDD140 pKa = 4.26GRR142 pKa = 11.84LFYY145 pKa = 10.76YY146 pKa = 11.39NMMTGDD152 pKa = 3.84RR153 pKa = 11.84SMEE156 pKa = 4.15LPLEE160 pKa = 4.58SPTT163 pKa = 4.26
Molecular weight: 18.16 kDa
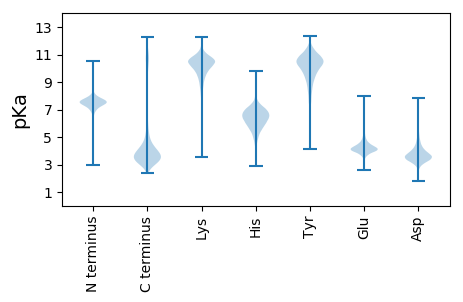
Isoelectric point according different methods:
Protein with the highest isoelectric point:
>tr|A0A544ZYW2|A0A544ZYW2_9PEZI Calponin-homology (CH) domain-containing protein OS=Golovinomyces magnicellulatus OX=62714 GN=Golomagni_05385 PE=4 SV=1
RR1 pKa = 7.04RR2 pKa = 11.84RR3 pKa = 11.84RR4 pKa = 11.84RR5 pKa = 11.84RR6 pKa = 11.84RR7 pKa = 11.84RR8 pKa = 11.84RR9 pKa = 11.84RR10 pKa = 11.84RR11 pKa = 11.84RR12 pKa = 11.84RR13 pKa = 11.84RR14 pKa = 11.84RR15 pKa = 11.84RR16 pKa = 11.84RR17 pKa = 11.84RR18 pKa = 11.84RR19 pKa = 11.84RR20 pKa = 11.84RR21 pKa = 11.84RR22 pKa = 11.84RR23 pKa = 11.84RR24 pKa = 11.84RR25 pKa = 11.84RR26 pKa = 11.84RR27 pKa = 11.84RR28 pKa = 11.84RR29 pKa = 11.84RR30 pKa = 11.84RR31 pKa = 11.84RR32 pKa = 11.84RR33 pKa = 11.84RR34 pKa = 11.84RR35 pKa = 11.84RR36 pKa = 11.84RR37 pKa = 11.84RR38 pKa = 11.84RR39 pKa = 11.84RR40 pKa = 11.84RR41 pKa = 11.84RR42 pKa = 11.84RR43 pKa = 11.84RR44 pKa = 11.84RR45 pKa = 11.84RR46 pKa = 11.84RR47 pKa = 11.84RR48 pKa = 11.84RR49 pKa = 11.84RR50 pKa = 11.84RR51 pKa = 11.84RR52 pKa = 11.84RR53 pKa = 11.84RR54 pKa = 11.84RR55 pKa = 11.84RR56 pKa = 11.84RR57 pKa = 11.84RR58 pKa = 11.84RR59 pKa = 11.84IEE61 pKa = 3.63ILIHH65 pKa = 6.24NSEE68 pKa = 4.39PTNISCVPTNTDD80 pKa = 2.31QWLKK84 pKa = 10.02GTTIDD89 pKa = 4.66SKK91 pKa = 11.53VV92 pKa = 2.94
RR1 pKa = 7.04RR2 pKa = 11.84RR3 pKa = 11.84RR4 pKa = 11.84RR5 pKa = 11.84RR6 pKa = 11.84RR7 pKa = 11.84RR8 pKa = 11.84RR9 pKa = 11.84RR10 pKa = 11.84RR11 pKa = 11.84RR12 pKa = 11.84RR13 pKa = 11.84RR14 pKa = 11.84RR15 pKa = 11.84RR16 pKa = 11.84RR17 pKa = 11.84RR18 pKa = 11.84RR19 pKa = 11.84RR20 pKa = 11.84RR21 pKa = 11.84RR22 pKa = 11.84RR23 pKa = 11.84RR24 pKa = 11.84RR25 pKa = 11.84RR26 pKa = 11.84RR27 pKa = 11.84RR28 pKa = 11.84RR29 pKa = 11.84RR30 pKa = 11.84RR31 pKa = 11.84RR32 pKa = 11.84RR33 pKa = 11.84RR34 pKa = 11.84RR35 pKa = 11.84RR36 pKa = 11.84RR37 pKa = 11.84RR38 pKa = 11.84RR39 pKa = 11.84RR40 pKa = 11.84RR41 pKa = 11.84RR42 pKa = 11.84RR43 pKa = 11.84RR44 pKa = 11.84RR45 pKa = 11.84RR46 pKa = 11.84RR47 pKa = 11.84RR48 pKa = 11.84RR49 pKa = 11.84RR50 pKa = 11.84RR51 pKa = 11.84RR52 pKa = 11.84RR53 pKa = 11.84RR54 pKa = 11.84RR55 pKa = 11.84RR56 pKa = 11.84RR57 pKa = 11.84RR58 pKa = 11.84RR59 pKa = 11.84IEE61 pKa = 3.63ILIHH65 pKa = 6.24NSEE68 pKa = 4.39PTNISCVPTNTDD80 pKa = 2.31QWLKK84 pKa = 10.02GTTIDD89 pKa = 4.66SKK91 pKa = 11.53VV92 pKa = 2.94
Molecular weight: 12.88 kDa
Isoelectric point according different methods:
Peptides (in silico digests for buttom-up proteomics)
Below you can find in silico digests of the whole proteome with Trypsin, Chymotrypsin, Trypsin+LysC, LysN, ArgC proteases suitable for different mass spec machines.| Try ESI |
 |
|---|
| ChTry ESI |
 |
|---|
| ArgC ESI |
 |
|---|
| LysN ESI |
 |
|---|
| TryLysC ESI |
 |
|---|
| Try MALDI |
 |
|---|
| ChTry MALDI |
 |
|---|
| ArgC MALDI |
 |
|---|
| LysN MALDI |
 |
|---|
| TryLysC MALDI |
 |
|---|
| Try LTQ |
 |
|---|
| ChTry LTQ |
 |
|---|
| ArgC LTQ |
 |
|---|
| LysN LTQ |
 |
|---|
| TryLysC LTQ |
 |
|---|
| Try MSlow |
 |
|---|
| ChTry MSlow |
 |
|---|
| ArgC MSlow |
 |
|---|
| LysN MSlow |
 |
|---|
| TryLysC MSlow |
 |
|---|
| Try MShigh |
 |
|---|
| ChTry MShigh |
 |
|---|
| ArgC MShigh |
 |
|---|
| LysN MShigh |
 |
|---|
| TryLysC MShigh |
 |
|---|
General Statistics
Number of major isoforms |
Number of additional isoforms |
Number of all proteins |
Number of amino acids |
Min. Seq. Length |
Max. Seq. Length |
Avg. Seq. Length |
Avg. Mol. Weight |
|---|---|---|---|---|---|---|---|
0 |
3553560 |
16 |
6734 |
435.0 |
48.67 |
Amino acid frequency
Ala |
Cys |
Asp |
Glu |
Phe |
Gly |
His |
Ile |
Lys |
Leu |
|---|---|---|---|---|---|---|---|---|---|
6.976 ± 0.025 | 1.293 ± 0.011 |
5.563 ± 0.019 | 6.473 ± 0.028 |
3.905 ± 0.017 | 5.913 ± 0.028 |
2.293 ± 0.012 | 6.171 ± 0.023 |
6.112 ± 0.027 | 9.126 ± 0.028 |
Met |
Asn |
Gln |
Pro |
Arg |
Ser |
Thr |
Val |
Trp |
Tyr |
|---|---|---|---|---|---|---|---|---|---|
2.082 ± 0.01 | 4.748 ± 0.018 |
5.095 ± 0.022 | 4.049 ± 0.022 |
5.704 ± 0.022 | 9.016 ± 0.038 |
5.799 ± 0.016 | 5.595 ± 0.016 |
1.257 ± 0.01 | 2.818 ± 0.014 |
Most of the basic statistics you can see at this page can be downloaded from this CSV file
Proteome-pI is available under Creative Commons Attribution-NoDerivs license, for more details see here
| Reference: Kozlowski LP. Proteome-pI 2.0: Proteome Isoelectric Point Database Update. Nucleic Acids Res. 2021, doi: 10.1093/nar/gkab944 | Contact: Lukasz P. Kozlowski |
