Pantoea phage vB_PagM_PSKM
Taxonomy: Viruses; Duplodnaviria; Heunggongvirae; Uroviricota; Caudoviricetes; Caudovirales; Myoviridae; Dibbivirus; Pantoea virus PSKM
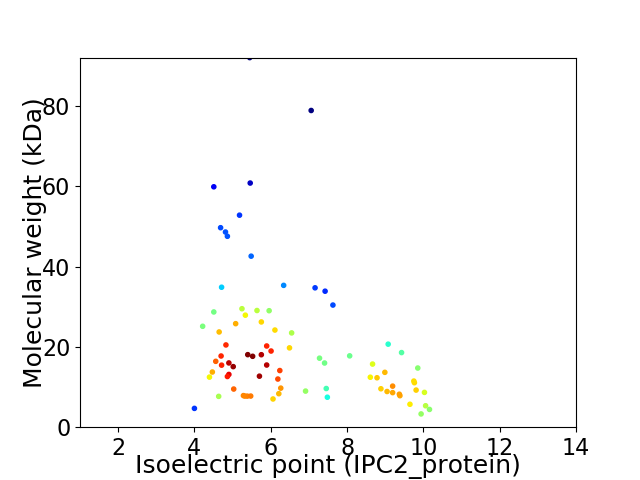
Average proteome isoelectric point is 6.53
Get precalculated fractions of proteins

Virtual 2D-PAGE plot for 82 proteins (isoelectric point calculated using IPC2_protein)
Get csv file with sequences according to given criteria:
* You can choose from 21 different methods for calculating isoelectric point
Summary statistics related to proteome-wise predictions


Protein with the lowest isoelectric point:
>tr|A0A513ZYN2|A0A513ZYN2_9CAUD Putative tail-completion protein OS=Pantoea phage vB_PagM_PSKM OX=2588094 GN=PSKM_gp15 PE=4 SV=1
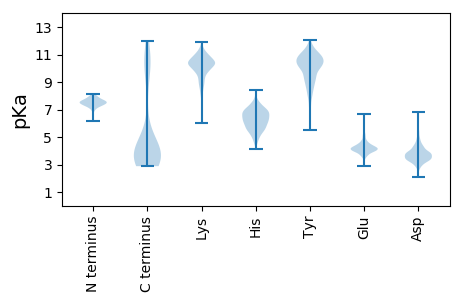
MM1 pKa = 7.53ALINISSGIITTPNSMGATEE21 pKa = 4.13TMGYY25 pKa = 9.31LSNMVYY31 pKa = 10.3DD32 pKa = 3.54QQQRR36 pKa = 11.84KK37 pKa = 9.1DD38 pKa = 3.49VEE40 pKa = 3.92ISFDD44 pKa = 3.39AFSLVEE50 pKa = 4.38SDD52 pKa = 4.46DD53 pKa = 4.54AEE55 pKa = 4.28PTAPLTDD62 pKa = 3.4EE63 pKa = 6.29DD64 pKa = 4.27IAQHH68 pKa = 5.75RR69 pKa = 11.84QDD71 pKa = 4.66DD72 pKa = 4.26KK73 pKa = 11.95VDD75 pKa = 3.54ALSFNAGEE83 pKa = 4.41HH84 pKa = 6.94LDD86 pKa = 3.92TLSDD90 pKa = 3.67IPVAGPDD97 pKa = 3.53YY98 pKa = 11.19SDD100 pKa = 3.24TSKK103 pKa = 11.36GLQEE107 pKa = 4.02YY108 pKa = 10.02LADD111 pKa = 3.34GWIISDD117 pKa = 3.6ANQYY121 pKa = 9.75YY122 pKa = 10.72SRR124 pKa = 11.84DD125 pKa = 3.88SFDD128 pKa = 3.15LMYY131 pKa = 11.11YY132 pKa = 10.66VDD134 pKa = 4.86FKK136 pKa = 11.43GGNVLLTRR144 pKa = 11.84AKK146 pKa = 10.25KK147 pKa = 8.8ATAGAEE153 pKa = 4.3PIHH156 pKa = 7.26VPVTVKK162 pKa = 9.98WVDD165 pKa = 3.47EE166 pKa = 4.2SDD168 pKa = 4.31CICWQCGKK176 pKa = 8.77PQNSAALAANDD187 pKa = 4.28FEE189 pKa = 5.58CLNCHH194 pKa = 6.37IKK196 pKa = 10.76VSDD199 pKa = 4.59DD200 pKa = 3.35LTPCITCGKK209 pKa = 10.0VITRR213 pKa = 11.84PGGAHH218 pKa = 4.9YY219 pKa = 10.52CNRR222 pKa = 11.84KK223 pKa = 9.62DD224 pKa = 4.18ADD226 pKa = 3.87STNSS230 pKa = 3.16
MM1 pKa = 7.53ALINISSGIITTPNSMGATEE21 pKa = 4.13TMGYY25 pKa = 9.31LSNMVYY31 pKa = 10.3DD32 pKa = 3.54QQQRR36 pKa = 11.84KK37 pKa = 9.1DD38 pKa = 3.49VEE40 pKa = 3.92ISFDD44 pKa = 3.39AFSLVEE50 pKa = 4.38SDD52 pKa = 4.46DD53 pKa = 4.54AEE55 pKa = 4.28PTAPLTDD62 pKa = 3.4EE63 pKa = 6.29DD64 pKa = 4.27IAQHH68 pKa = 5.75RR69 pKa = 11.84QDD71 pKa = 4.66DD72 pKa = 4.26KK73 pKa = 11.95VDD75 pKa = 3.54ALSFNAGEE83 pKa = 4.41HH84 pKa = 6.94LDD86 pKa = 3.92TLSDD90 pKa = 3.67IPVAGPDD97 pKa = 3.53YY98 pKa = 11.19SDD100 pKa = 3.24TSKK103 pKa = 11.36GLQEE107 pKa = 4.02YY108 pKa = 10.02LADD111 pKa = 3.34GWIISDD117 pKa = 3.6ANQYY121 pKa = 9.75YY122 pKa = 10.72SRR124 pKa = 11.84DD125 pKa = 3.88SFDD128 pKa = 3.15LMYY131 pKa = 11.11YY132 pKa = 10.66VDD134 pKa = 4.86FKK136 pKa = 11.43GGNVLLTRR144 pKa = 11.84AKK146 pKa = 10.25KK147 pKa = 8.8ATAGAEE153 pKa = 4.3PIHH156 pKa = 7.26VPVTVKK162 pKa = 9.98WVDD165 pKa = 3.47EE166 pKa = 4.2SDD168 pKa = 4.31CICWQCGKK176 pKa = 8.77PQNSAALAANDD187 pKa = 4.28FEE189 pKa = 5.58CLNCHH194 pKa = 6.37IKK196 pKa = 10.76VSDD199 pKa = 4.59DD200 pKa = 3.35LTPCITCGKK209 pKa = 10.0VITRR213 pKa = 11.84PGGAHH218 pKa = 4.9YY219 pKa = 10.52CNRR222 pKa = 11.84KK223 pKa = 9.62DD224 pKa = 4.18ADD226 pKa = 3.87STNSS230 pKa = 3.16
Molecular weight: 25.14 kDa
Isoelectric point according different methods:
Protein with the highest isoelectric point:
>tr|A0A513ZYR1|A0A513ZYR1_9CAUD Uncharacterized protein OS=Pantoea phage vB_PagM_PSKM OX=2588094 GN=PSKM_gp60 PE=4 SV=1
MM1 pKa = 7.47SKK3 pKa = 11.07ASIAVSNQLAATAVPVITDD22 pKa = 3.86GGRR25 pKa = 11.84QTWRR29 pKa = 11.84KK30 pKa = 8.13KK31 pKa = 10.79LVMIPMLHH39 pKa = 6.72HH40 pKa = 5.99MAQYY44 pKa = 11.08AEE46 pKa = 4.68LMDD49 pKa = 3.8KK50 pKa = 9.83FHH52 pKa = 7.52RR53 pKa = 11.84LGSVPSSHH61 pKa = 5.9YY62 pKa = 9.09RR63 pKa = 11.84HH64 pKa = 6.22RR65 pKa = 11.84LIVTGEE71 pKa = 4.02RR72 pKa = 11.84LVEE75 pKa = 4.1GAGEE79 pKa = 4.06HH80 pKa = 6.59GEE82 pKa = 4.17PKK84 pKa = 10.6VMPVYY89 pKa = 10.61HH90 pKa = 5.93FVHH93 pKa = 6.86RR94 pKa = 11.84KK95 pKa = 6.72MKK97 pKa = 10.48SRR99 pKa = 11.84AKK101 pKa = 10.28LDD103 pKa = 3.3RR104 pKa = 11.84CFPRR108 pKa = 11.84GKK110 pKa = 10.37AYY112 pKa = 10.31GRR114 pKa = 11.84IMDD117 pKa = 4.78LARR120 pKa = 11.84IRR122 pKa = 11.84AAQVKK127 pKa = 10.17AGVVV131 pKa = 3.23
MM1 pKa = 7.47SKK3 pKa = 11.07ASIAVSNQLAATAVPVITDD22 pKa = 3.86GGRR25 pKa = 11.84QTWRR29 pKa = 11.84KK30 pKa = 8.13KK31 pKa = 10.79LVMIPMLHH39 pKa = 6.72HH40 pKa = 5.99MAQYY44 pKa = 11.08AEE46 pKa = 4.68LMDD49 pKa = 3.8KK50 pKa = 9.83FHH52 pKa = 7.52RR53 pKa = 11.84LGSVPSSHH61 pKa = 5.9YY62 pKa = 9.09RR63 pKa = 11.84HH64 pKa = 6.22RR65 pKa = 11.84LIVTGEE71 pKa = 4.02RR72 pKa = 11.84LVEE75 pKa = 4.1GAGEE79 pKa = 4.06HH80 pKa = 6.59GEE82 pKa = 4.17PKK84 pKa = 10.6VMPVYY89 pKa = 10.61HH90 pKa = 5.93FVHH93 pKa = 6.86RR94 pKa = 11.84KK95 pKa = 6.72MKK97 pKa = 10.48SRR99 pKa = 11.84AKK101 pKa = 10.28LDD103 pKa = 3.3RR104 pKa = 11.84CFPRR108 pKa = 11.84GKK110 pKa = 10.37AYY112 pKa = 10.31GRR114 pKa = 11.84IMDD117 pKa = 4.78LARR120 pKa = 11.84IRR122 pKa = 11.84AAQVKK127 pKa = 10.17AGVVV131 pKa = 3.23
Molecular weight: 14.74 kDa
Isoelectric point according different methods:
Peptides (in silico digests for buttom-up proteomics)
Below you can find in silico digests of the whole proteome with Trypsin, Chymotrypsin, Trypsin+LysC, LysN, ArgC proteases suitable for different mass spec machines.| Try ESI |
 |
|---|
| ChTry ESI |
 |
|---|
| ArgC ESI |
 |
|---|
| LysN ESI |
 |
|---|
| TryLysC ESI |
 |
|---|
| Try MALDI |
 |
|---|
| ChTry MALDI |
 |
|---|
| ArgC MALDI |
 |
|---|
| LysN MALDI |
 |
|---|
| TryLysC MALDI |
 |
|---|
| Try LTQ |
 |
|---|
| ChTry LTQ |
 |
|---|
| ArgC LTQ |
 |
|---|
| LysN LTQ |
 |
|---|
| TryLysC LTQ |
 |
|---|
| Try MSlow |
 |
|---|
| ChTry MSlow |
 |
|---|
| ArgC MSlow |
 |
|---|
| LysN MSlow |
 |
|---|
| TryLysC MSlow |
 |
|---|
| Try MShigh |
 |
|---|
| ChTry MShigh |
 |
|---|
| ArgC MShigh |
 |
|---|
| LysN MShigh |
 |
|---|
| TryLysC MShigh |
 |
|---|
General Statistics
Number of major isoforms |
Number of additional isoforms |
Number of all proteins |
Number of amino acids |
Min. Seq. Length |
Max. Seq. Length |
Avg. Seq. Length |
Avg. Mol. Weight |
|---|---|---|---|---|---|---|---|
0 |
15278 |
31 |
852 |
186.3 |
20.63 |
Amino acid frequency
Ala |
Cys |
Asp |
Glu |
Phe |
Gly |
His |
Ile |
Lys |
Leu |
|---|---|---|---|---|---|---|---|---|---|
9.451 ± 0.367 | 1.008 ± 0.141 |
6.428 ± 0.206 | 5.943 ± 0.314 |
3.659 ± 0.181 | 7.979 ± 0.356 |
1.99 ± 0.195 | 6.349 ± 0.213 |
5.616 ± 0.233 | 7.128 ± 0.222 |
Met |
Asn |
Gln |
Pro |
Arg |
Ser |
Thr |
Val |
Trp |
Tyr |
|---|---|---|---|---|---|---|---|---|---|
2.893 ± 0.138 | 4.726 ± 0.21 |
3.613 ± 0.154 | 4.006 ± 0.186 |
5.603 ± 0.245 | 6.166 ± 0.2 |
5.727 ± 0.217 | 7.036 ± 0.239 |
1.335 ± 0.125 | 3.345 ± 0.144 |
Most of the basic statistics you can see at this page can be downloaded from this CSV file
Proteome-pI is available under Creative Commons Attribution-NoDerivs license, for more details see here
| Reference: Kozlowski LP. Proteome-pI 2.0: Proteome Isoelectric Point Database Update. Nucleic Acids Res. 2021, doi: 10.1093/nar/gkab944 | Contact: Lukasz P. Kozlowski |
