Sphingobacterium lactis
Taxonomy: cellular organisms; Bacteria; FCB group; Bacteroidetes/Chlorobi group; Bacteroidetes; Sphingobacteriia; Sphingobacteriales; Sphingobacteriaceae; Sphingobacterium
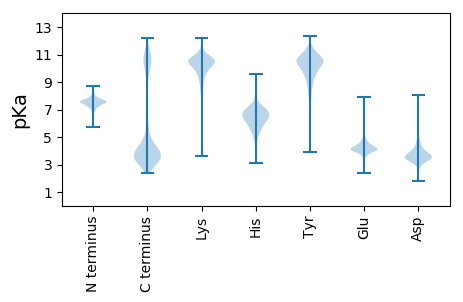
Average proteome isoelectric point is 6.46
Get precalculated fractions of proteins

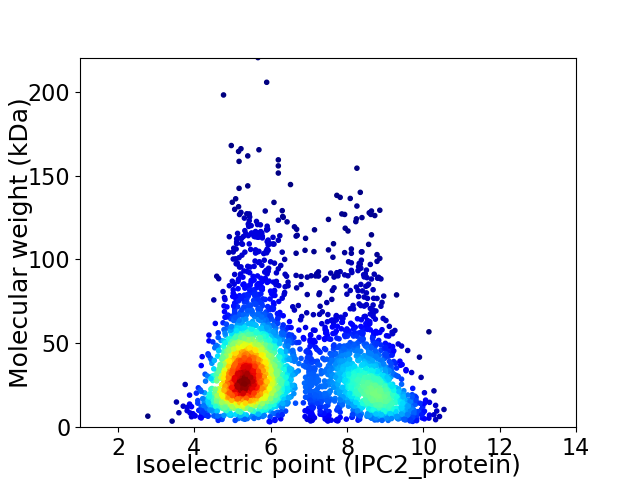
Virtual 2D-PAGE plot for 3523 proteins (isoelectric point calculated using IPC2_protein)
Get csv file with sequences according to given criteria:
* You can choose from 21 different methods for calculating isoelectric point
Summary statistics related to proteome-wise predictions


Protein with the lowest isoelectric point:
>tr|A0A1H5TS81|A0A1H5TS81_9SPHI Transcriptional regulator ArsR family OS=Sphingobacterium lactis OX=797291 GN=SAMN05421877_10267 PE=4 SV=1
MM1 pKa = 7.77ANWCNNWVVFEE12 pKa = 4.32GTAEE16 pKa = 4.56AIEE19 pKa = 4.34QITKK23 pKa = 10.17LFKK26 pKa = 11.18SMAEE30 pKa = 3.89QEE32 pKa = 4.29QKK34 pKa = 11.02DD35 pKa = 3.85DD36 pKa = 4.27CGQLPDD42 pKa = 4.99FVQDD46 pKa = 2.99THH48 pKa = 8.32GDD50 pKa = 3.44YY51 pKa = 10.62FYY53 pKa = 11.16NISQDD58 pKa = 3.51NEE60 pKa = 4.29SAGVFQYY67 pKa = 7.25EE68 pKa = 4.91TKK70 pKa = 10.2WSPNTDD76 pKa = 2.87AVKK79 pKa = 10.55QIAEE83 pKa = 4.05HH84 pKa = 5.9FKK86 pKa = 11.12VNFTQDD92 pKa = 3.63YY93 pKa = 9.93EE94 pKa = 4.3EE95 pKa = 5.16LGCLVYY101 pKa = 10.63GQAIFEE107 pKa = 4.27EE108 pKa = 5.99GILTDD113 pKa = 3.61TCLDD117 pKa = 3.63SQDD120 pKa = 3.46FDD122 pKa = 4.42SYY124 pKa = 11.79EE125 pKa = 4.21LDD127 pKa = 3.79EE128 pKa = 4.65EE129 pKa = 4.42TDD131 pKa = 3.52TYY133 pKa = 11.13HH134 pKa = 7.57FEE136 pKa = 3.75GTEE139 pKa = 3.91YY140 pKa = 10.97DD141 pKa = 4.18SEE143 pKa = 4.28WEE145 pKa = 3.97ILDD148 pKa = 3.59TLLEE152 pKa = 4.4RR153 pKa = 11.84KK154 pKa = 9.52SEE156 pKa = 4.07NQLNTIKK163 pKa = 10.43II164 pKa = 3.87
MM1 pKa = 7.77ANWCNNWVVFEE12 pKa = 4.32GTAEE16 pKa = 4.56AIEE19 pKa = 4.34QITKK23 pKa = 10.17LFKK26 pKa = 11.18SMAEE30 pKa = 3.89QEE32 pKa = 4.29QKK34 pKa = 11.02DD35 pKa = 3.85DD36 pKa = 4.27CGQLPDD42 pKa = 4.99FVQDD46 pKa = 2.99THH48 pKa = 8.32GDD50 pKa = 3.44YY51 pKa = 10.62FYY53 pKa = 11.16NISQDD58 pKa = 3.51NEE60 pKa = 4.29SAGVFQYY67 pKa = 7.25EE68 pKa = 4.91TKK70 pKa = 10.2WSPNTDD76 pKa = 2.87AVKK79 pKa = 10.55QIAEE83 pKa = 4.05HH84 pKa = 5.9FKK86 pKa = 11.12VNFTQDD92 pKa = 3.63YY93 pKa = 9.93EE94 pKa = 4.3EE95 pKa = 5.16LGCLVYY101 pKa = 10.63GQAIFEE107 pKa = 4.27EE108 pKa = 5.99GILTDD113 pKa = 3.61TCLDD117 pKa = 3.63SQDD120 pKa = 3.46FDD122 pKa = 4.42SYY124 pKa = 11.79EE125 pKa = 4.21LDD127 pKa = 3.79EE128 pKa = 4.65EE129 pKa = 4.42TDD131 pKa = 3.52TYY133 pKa = 11.13HH134 pKa = 7.57FEE136 pKa = 3.75GTEE139 pKa = 3.91YY140 pKa = 10.97DD141 pKa = 4.18SEE143 pKa = 4.28WEE145 pKa = 3.97ILDD148 pKa = 3.59TLLEE152 pKa = 4.4RR153 pKa = 11.84KK154 pKa = 9.52SEE156 pKa = 4.07NQLNTIKK163 pKa = 10.43II164 pKa = 3.87
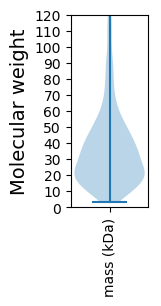
Molecular weight: 19.11 kDa
Isoelectric point according different methods:
Protein with the highest isoelectric point:
>tr|A0A1H6C3J4|A0A1H6C3J4_9SPHI Uncharacterized protein OS=Sphingobacterium lactis OX=797291 GN=SAMN05421877_11314 PE=4 SV=1
MM1 pKa = 7.27GVLVLMVCSGVSKK14 pKa = 10.46IVTPLRR20 pKa = 11.84GWHH23 pKa = 4.89VRR25 pKa = 11.84YY26 pKa = 9.37PNRR29 pKa = 11.84SLYY32 pKa = 10.69LLPKK36 pKa = 9.49CGKK39 pKa = 8.6GTVKK43 pKa = 10.19CFCAYY48 pKa = 10.49GMFRR52 pKa = 11.84HH53 pKa = 6.54KK54 pKa = 10.73SATTQAHH61 pKa = 5.53YY62 pKa = 10.74KK63 pKa = 9.87RR64 pKa = 11.84LAPACEE70 pKa = 3.94LTRR73 pKa = 11.84LGEE76 pKa = 3.96ILRR79 pKa = 11.84GNGRR83 pKa = 11.84ALRR86 pKa = 11.84AHH88 pKa = 6.55SLSKK92 pKa = 10.51SLPYY96 pKa = 10.22FNRR99 pKa = 11.84PMLAQEE105 pKa = 4.01LCGRR109 pKa = 11.84ATRR112 pKa = 11.84WISCAFGMRR121 pKa = 11.84QHH123 pKa = 6.67SLPKK127 pKa = 9.27SLPYY131 pKa = 10.15FMCTTLAQEE140 pKa = 3.77LCGRR144 pKa = 11.84VVRR147 pKa = 11.84RR148 pKa = 11.84ISCAQGMRR156 pKa = 11.84QHH158 pKa = 7.48PYY160 pKa = 9.81HH161 pKa = 6.64SRR163 pKa = 3.22
MM1 pKa = 7.27GVLVLMVCSGVSKK14 pKa = 10.46IVTPLRR20 pKa = 11.84GWHH23 pKa = 4.89VRR25 pKa = 11.84YY26 pKa = 9.37PNRR29 pKa = 11.84SLYY32 pKa = 10.69LLPKK36 pKa = 9.49CGKK39 pKa = 8.6GTVKK43 pKa = 10.19CFCAYY48 pKa = 10.49GMFRR52 pKa = 11.84HH53 pKa = 6.54KK54 pKa = 10.73SATTQAHH61 pKa = 5.53YY62 pKa = 10.74KK63 pKa = 9.87RR64 pKa = 11.84LAPACEE70 pKa = 3.94LTRR73 pKa = 11.84LGEE76 pKa = 3.96ILRR79 pKa = 11.84GNGRR83 pKa = 11.84ALRR86 pKa = 11.84AHH88 pKa = 6.55SLSKK92 pKa = 10.51SLPYY96 pKa = 10.22FNRR99 pKa = 11.84PMLAQEE105 pKa = 4.01LCGRR109 pKa = 11.84ATRR112 pKa = 11.84WISCAFGMRR121 pKa = 11.84QHH123 pKa = 6.67SLPKK127 pKa = 9.27SLPYY131 pKa = 10.15FMCTTLAQEE140 pKa = 3.77LCGRR144 pKa = 11.84VVRR147 pKa = 11.84RR148 pKa = 11.84ISCAQGMRR156 pKa = 11.84QHH158 pKa = 7.48PYY160 pKa = 9.81HH161 pKa = 6.64SRR163 pKa = 3.22
Molecular weight: 18.46 kDa
Isoelectric point according different methods:
Peptides (in silico digests for buttom-up proteomics)
Below you can find in silico digests of the whole proteome with Trypsin, Chymotrypsin, Trypsin+LysC, LysN, ArgC proteases suitable for different mass spec machines.| Try ESI |
 |
|---|
| ChTry ESI |
 |
|---|
| ArgC ESI |
 |
|---|
| LysN ESI |
 |
|---|
| TryLysC ESI |
 |
|---|
| Try MALDI |
 |
|---|
| ChTry MALDI |
 |
|---|
| ArgC MALDI |
 |
|---|
| LysN MALDI |
 |
|---|
| TryLysC MALDI |
 |
|---|
| Try LTQ |
 |
|---|
| ChTry LTQ |
 |
|---|
| ArgC LTQ |
 |
|---|
| LysN LTQ |
 |
|---|
| TryLysC LTQ |
 |
|---|
| Try MSlow |
 |
|---|
| ChTry MSlow |
 |
|---|
| ArgC MSlow |
 |
|---|
| LysN MSlow |
 |
|---|
| TryLysC MSlow |
 |
|---|
| Try MShigh |
 |
|---|
| ChTry MShigh |
 |
|---|
| ArgC MShigh |
 |
|---|
| LysN MShigh |
 |
|---|
| TryLysC MShigh |
 |
|---|
General Statistics
Number of major isoforms |
Number of additional isoforms |
Number of all proteins |
Number of amino acids |
Min. Seq. Length |
Max. Seq. Length |
Avg. Seq. Length |
Avg. Mol. Weight |
|---|---|---|---|---|---|---|---|
0 |
1183612 |
30 |
1928 |
336.0 |
37.82 |
Amino acid frequency
Ala |
Cys |
Asp |
Glu |
Phe |
Gly |
His |
Ile |
Lys |
Leu |
|---|---|---|---|---|---|---|---|---|---|
7.31 ± 0.04 | 0.696 ± 0.012 |
5.552 ± 0.029 | 6.311 ± 0.044 |
5.002 ± 0.028 | 6.81 ± 0.043 |
1.94 ± 0.023 | 7.223 ± 0.035 |
6.893 ± 0.036 | 9.494 ± 0.046 |
Met |
Asn |
Gln |
Pro |
Arg |
Ser |
Thr |
Val |
Trp |
Tyr |
|---|---|---|---|---|---|---|---|---|---|
2.447 ± 0.018 | 5.432 ± 0.039 |
3.719 ± 0.022 | 3.959 ± 0.028 |
4.088 ± 0.027 | 6.138 ± 0.032 |
5.349 ± 0.028 | 6.381 ± 0.03 |
1.148 ± 0.015 | 4.11 ± 0.028 |
Most of the basic statistics you can see at this page can be downloaded from this CSV file
Proteome-pI is available under Creative Commons Attribution-NoDerivs license, for more details see here
| Reference: Kozlowski LP. Proteome-pI 2.0: Proteome Isoelectric Point Database Update. Nucleic Acids Res. 2021, doi: 10.1093/nar/gkab944 | Contact: Lukasz P. Kozlowski |
