Escherichia phage aldrigsur
Taxonomy: Viruses; Duplodnaviria; Heunggongvirae; Uroviricota; Caudoviricetes; Caudovirales; Autographiviridae; Bonnellvirus; unclassified Bonnellvirus
Average proteome isoelectric point is 5.85
Get precalculated fractions of proteins
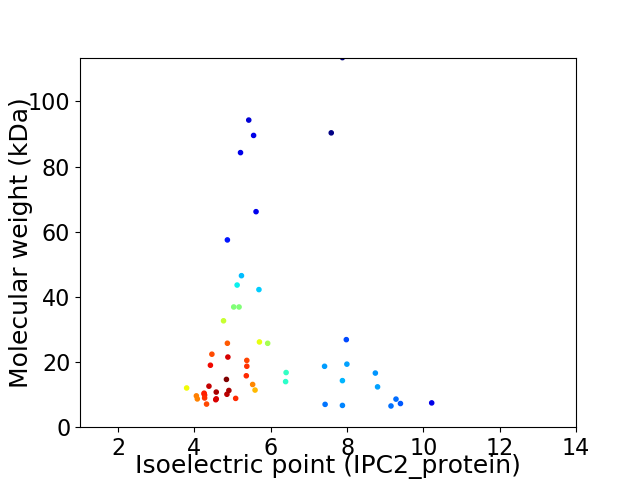
Virtual 2D-PAGE plot for 54 proteins (isoelectric point calculated using IPC2_protein)
Get csv file with sequences according to given criteria:
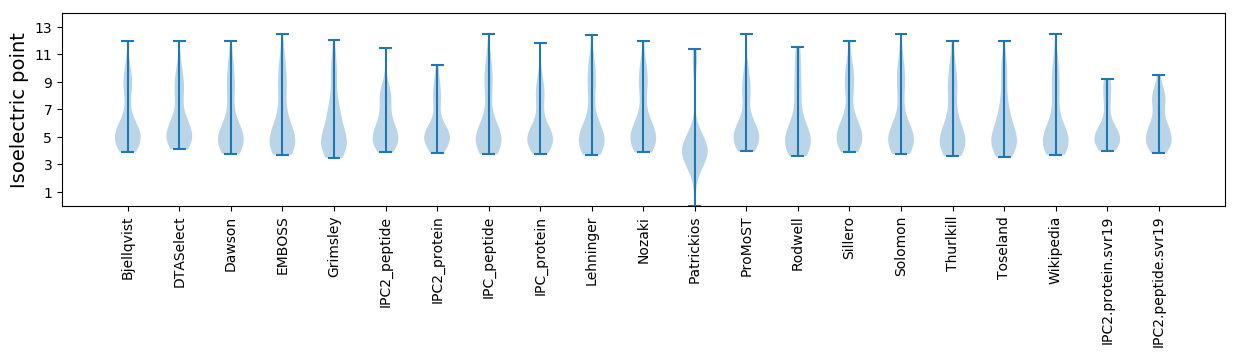
* You can choose from 21 different methods for calculating isoelectric point
Summary statistics related to proteome-wise predictions
Protein with the lowest isoelectric point:
>tr|A0A6B9WVS8|A0A6B9WVS8_9CAUD Uncharacterized protein OS=Escherichia phage aldrigsur OX=2696378 GN=aldrigsur_10 PE=4 SV=1
MM1 pKa = 7.47ALVDD5 pKa = 3.57STAAEE10 pKa = 3.86RR11 pKa = 11.84AEE13 pKa = 5.0FVAACNMAAKK23 pKa = 9.82YY24 pKa = 10.73LNVWTEE30 pKa = 4.4DD31 pKa = 3.66YY32 pKa = 11.2FFDD35 pKa = 3.72TTNTEE40 pKa = 3.74LVAYY44 pKa = 7.89YY45 pKa = 8.17QTFVTRR51 pKa = 11.84VQTALTNLTNGGAA64 pKa = 3.51
MM1 pKa = 7.47ALVDD5 pKa = 3.57STAAEE10 pKa = 3.86RR11 pKa = 11.84AEE13 pKa = 5.0FVAACNMAAKK23 pKa = 9.82YY24 pKa = 10.73LNVWTEE30 pKa = 4.4DD31 pKa = 3.66YY32 pKa = 11.2FFDD35 pKa = 3.72TTNTEE40 pKa = 3.74LVAYY44 pKa = 7.89YY45 pKa = 8.17QTFVTRR51 pKa = 11.84VQTALTNLTNGGAA64 pKa = 3.51
Molecular weight: 7.09 kDa
Isoelectric point according different methods:
Protein with the highest isoelectric point:
>tr|A0A6B9WS49|A0A6B9WS49_9CAUD Uncharacterized protein OS=Escherichia phage aldrigsur OX=2696378 GN=aldrigsur_33 PE=4 SV=1
MM1 pKa = 7.8EE2 pKa = 4.56EE3 pKa = 3.64RR4 pKa = 11.84TYY6 pKa = 10.97RR7 pKa = 11.84AAPLNQRR14 pKa = 11.84EE15 pKa = 4.14QATIRR20 pKa = 11.84AQYY23 pKa = 10.49RR24 pKa = 11.84KK25 pKa = 10.09GDD27 pKa = 3.59AFRR30 pKa = 11.84GAEE33 pKa = 3.82ALAEE37 pKa = 4.11RR38 pKa = 11.84FNVPPADD45 pKa = 3.33VVAVVNFTYY54 pKa = 10.52RR55 pKa = 11.84KK56 pKa = 9.82GKK58 pKa = 9.52QKK60 pKa = 10.4HH61 pKa = 6.33DD62 pKa = 3.52KK63 pKa = 10.67
MM1 pKa = 7.8EE2 pKa = 4.56EE3 pKa = 3.64RR4 pKa = 11.84TYY6 pKa = 10.97RR7 pKa = 11.84AAPLNQRR14 pKa = 11.84EE15 pKa = 4.14QATIRR20 pKa = 11.84AQYY23 pKa = 10.49RR24 pKa = 11.84KK25 pKa = 10.09GDD27 pKa = 3.59AFRR30 pKa = 11.84GAEE33 pKa = 3.82ALAEE37 pKa = 4.11RR38 pKa = 11.84FNVPPADD45 pKa = 3.33VVAVVNFTYY54 pKa = 10.52RR55 pKa = 11.84KK56 pKa = 9.82GKK58 pKa = 9.52QKK60 pKa = 10.4HH61 pKa = 6.33DD62 pKa = 3.52KK63 pKa = 10.67
Molecular weight: 7.27 kDa
Isoelectric point according different methods:
Peptides (in silico digests for buttom-up proteomics)
Below you can find in silico digests of the whole proteome with Trypsin, Chymotrypsin, Trypsin+LysC, LysN, ArgC proteases suitable for different mass spec machines.| Try ESI |
 |
|---|
| ChTry ESI |
|
|---|
| ArgC ESI |
|
|---|
| LysN ESI |
|
|---|
| TryLysC ESI |
|
|---|
| Try MALDI |
|
|---|
| ChTry MALDI |
|
|---|
| ArgC MALDI |
|
|---|
| LysN MALDI |
|
|---|
| TryLysC MALDI |
|
|---|
| Try LTQ |
|
|---|
| ChTry LTQ |
|
|---|
| ArgC LTQ |
|
|---|
| LysN LTQ |
|
|---|
| TryLysC LTQ |
|
|---|
| Try MSlow |
|
|---|
| ChTry MSlow |
|
|---|
| ArgC MSlow |
|
|---|
| LysN MSlow |
|
|---|
| TryLysC MSlow |
|
|---|
| Try MShigh |
|
|---|
| ChTry MShigh |
|
|---|
| ArgC MShigh |
|
|---|
| LysN MShigh |
|
|---|
| TryLysC MShigh |
|
|---|
General Statistics
Number of major isoforms |
Number of additional isoforms |
Number of all proteins |
Number of amino acids |
Min. Seq. Length |
Max. Seq. Length |
Avg. Seq. Length |
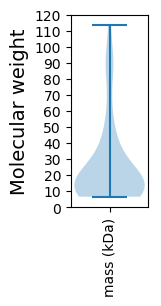
Avg. Mol. Weight |
|---|---|---|---|---|---|---|---|
0 |
12665 |
56 |
1036 |
234.5 |
25.91 |
Amino acid frequency
Ala |
Cys |
Asp |
Glu |
Phe |
Gly |
His |
Ile |
Lys |
Leu |
|---|---|---|---|---|---|---|---|---|---|
10.225 ± 0.592 | 0.94 ± 0.155 |
6.103 ± 0.3 | 6.182 ± 0.391 |
3.466 ± 0.201 | 7.833 ± 0.367 |
2.037 ± 0.229 | 4.659 ± 0.242 |
4.358 ± 0.303 | 8.133 ± 0.285 |
Met |
Asn |
Gln |
Pro |
Arg |
Ser |
Thr |
Val |
Trp |
Tyr |
|---|---|---|---|---|---|---|---|---|---|
2.866 ± 0.303 | 4.145 ± 0.316 |
4.343 ± 0.299 | 4.714 ± 0.45 |
5.638 ± 0.317 | 5.653 ± 0.316 |
6.151 ± 0.487 | 7.469 ± 0.385 |
1.516 ± 0.155 | 3.569 ± 0.248 |
Most of the basic statistics you can see at this page can be downloaded from this CSV file
See this proteome in:

Proteome-pI is available under Creative Commons Attribution-NoDerivs license, for more details see here
| Reference: Kozlowski LP. Proteome-pI 2.0: Proteome Isoelectric Point Database Update. Nucleic Acids Res. 2021, doi: 10.1093/nar/gkab944 | Contact: Lukasz P. Kozlowski |