Desulfovibrio bizertensis DSM 18034
Taxonomy: cellular organisms; Bacteria; Proteobacteria; delta/epsilon subdivisions; Deltaproteobacteria; Desulfovibrionales; Desulfovibrionaceae; Desulfovibrio; Desulfovibrio bizertensis
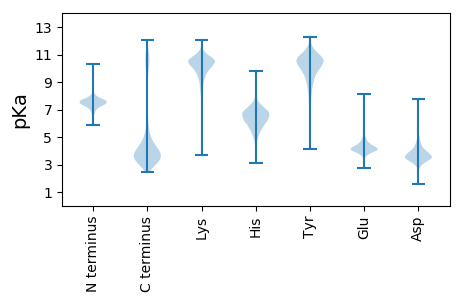
Average proteome isoelectric point is 6.51
Get precalculated fractions of proteins

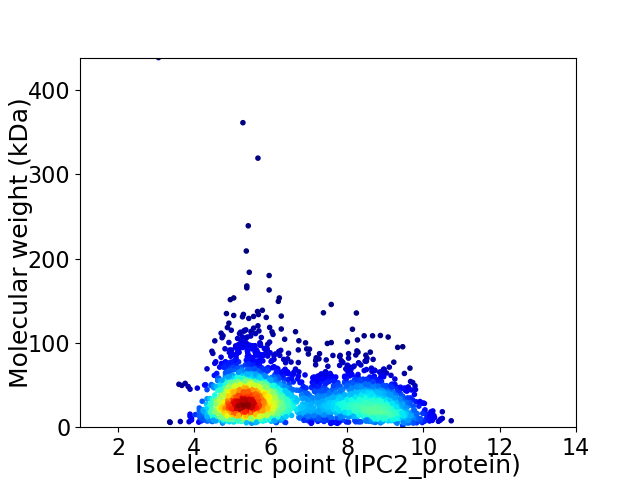
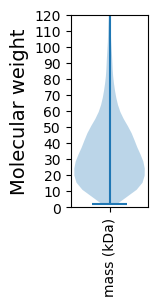
Virtual 2D-PAGE plot for 2903 proteins (isoelectric point calculated using IPC2_protein)
Get csv file with sequences according to given criteria:
* You can choose from 21 different methods for calculating isoelectric point
Summary statistics related to proteome-wise predictions


Protein with the lowest isoelectric point:
>tr|A0A1T4VVU7|A0A1T4VVU7_9DELT Choloylglycine hydrolase OS=Desulfovibrio bizertensis DSM 18034 OX=1121442 GN=SAMN02745702_01034 PE=3 SV=1
MM1 pKa = 8.09VSITQAARR9 pKa = 11.84EE10 pKa = 3.97EE11 pKa = 4.17LVKK14 pKa = 10.69FFEE17 pKa = 5.44DD18 pKa = 3.79KK19 pKa = 10.65DD20 pKa = 3.75VSPIRR25 pKa = 11.84IYY27 pKa = 10.54LAPGGCSGPRR37 pKa = 11.84LSLALDD43 pKa = 3.64KK44 pKa = 11.47ANEE47 pKa = 4.16SDD49 pKa = 4.89DD50 pKa = 5.16SFDD53 pKa = 5.17LGDD56 pKa = 3.69NLTFVVDD63 pKa = 4.39KK64 pKa = 10.66NLCAKK69 pKa = 8.9AQPITIDD76 pKa = 3.02MSYY79 pKa = 11.04AGFVLEE85 pKa = 5.25SSLDD89 pKa = 3.6LGNEE93 pKa = 4.34GGCGGGCGGCGSSSSCCGSS112 pKa = 3.03
MM1 pKa = 8.09VSITQAARR9 pKa = 11.84EE10 pKa = 3.97EE11 pKa = 4.17LVKK14 pKa = 10.69FFEE17 pKa = 5.44DD18 pKa = 3.79KK19 pKa = 10.65DD20 pKa = 3.75VSPIRR25 pKa = 11.84IYY27 pKa = 10.54LAPGGCSGPRR37 pKa = 11.84LSLALDD43 pKa = 3.64KK44 pKa = 11.47ANEE47 pKa = 4.16SDD49 pKa = 4.89DD50 pKa = 5.16SFDD53 pKa = 5.17LGDD56 pKa = 3.69NLTFVVDD63 pKa = 4.39KK64 pKa = 10.66NLCAKK69 pKa = 8.9AQPITIDD76 pKa = 3.02MSYY79 pKa = 11.04AGFVLEE85 pKa = 5.25SSLDD89 pKa = 3.6LGNEE93 pKa = 4.34GGCGGGCGGCGSSSSCCGSS112 pKa = 3.03
Molecular weight: 11.55 kDa
Isoelectric point according different methods:
Protein with the highest isoelectric point:
>tr|A0A1T4VQW4|A0A1T4VQW4_9DELT Permease of the drug/metabolite transporter (DMT) superfamily OS=Desulfovibrio bizertensis DSM 18034 OX=1121442 GN=SAMN02745702_00796 PE=4 SV=1
MM1 pKa = 7.32RR2 pKa = 11.84HH3 pKa = 6.13ALRR6 pKa = 11.84FACHH10 pKa = 6.31GATVSTSAVAPFSFSLFFPTPTPLYY35 pKa = 10.08IIRR38 pKa = 11.84QQQHH42 pKa = 5.13AKK44 pKa = 9.67KK45 pKa = 8.27STRR48 pKa = 11.84ISRR51 pKa = 11.84TQIMRR56 pKa = 11.84QNCRR60 pKa = 11.84SGMRR64 pKa = 11.84QFFHH68 pKa = 7.33AGQKK72 pKa = 10.13CRR74 pKa = 11.84TCISPNSNAFEE85 pKa = 4.33EE86 pKa = 4.34YY87 pKa = 10.86LPLFSVKK94 pKa = 8.6YY95 pKa = 8.28TAFFLLRR102 pKa = 11.84FTFRR106 pKa = 11.84IRR108 pKa = 11.84NDD110 pKa = 3.82RR111 pKa = 11.84IVAALEE117 pKa = 4.03SPQRR121 pKa = 11.84DD122 pKa = 3.75ATNLSYY128 pKa = 11.01SKK130 pKa = 10.87KK131 pKa = 9.87PVNTGDD137 pKa = 3.63FLDD140 pKa = 4.08IQSFPATFLSPPQSSLSRR158 pKa = 11.84RR159 pKa = 11.84DD160 pKa = 2.97IKK162 pKa = 9.09TTGKK166 pKa = 10.29ARR168 pKa = 11.84YY169 pKa = 9.06CSIFKK174 pKa = 10.83VGTTDD179 pKa = 2.9ARR181 pKa = 11.84YY182 pKa = 8.97SAIPKK187 pKa = 9.62RR188 pKa = 11.84YY189 pKa = 8.09YY190 pKa = 10.22SCPPVLQRR198 pKa = 11.84YY199 pKa = 8.68ISSTAGLPRR208 pKa = 11.84FAFVHH213 pKa = 5.51YY214 pKa = 10.57LLTLHH219 pKa = 6.25LQGRR223 pKa = 11.84RR224 pKa = 11.84DD225 pKa = 3.71QMHH228 pKa = 5.72SQCLLSRR235 pKa = 11.84YY236 pKa = 8.84CKK238 pKa = 9.37WSLGKK243 pKa = 8.97GTPSAALKK251 pKa = 10.32RR252 pKa = 11.84YY253 pKa = 9.58GGEE256 pKa = 4.16CTSHH260 pKa = 6.23IFSRR264 pKa = 11.84PSCFGCTQLRR274 pKa = 11.84KK275 pKa = 9.8LLLEE279 pKa = 3.83LHH281 pKa = 6.7PWW283 pKa = 3.36
MM1 pKa = 7.32RR2 pKa = 11.84HH3 pKa = 6.13ALRR6 pKa = 11.84FACHH10 pKa = 6.31GATVSTSAVAPFSFSLFFPTPTPLYY35 pKa = 10.08IIRR38 pKa = 11.84QQQHH42 pKa = 5.13AKK44 pKa = 9.67KK45 pKa = 8.27STRR48 pKa = 11.84ISRR51 pKa = 11.84TQIMRR56 pKa = 11.84QNCRR60 pKa = 11.84SGMRR64 pKa = 11.84QFFHH68 pKa = 7.33AGQKK72 pKa = 10.13CRR74 pKa = 11.84TCISPNSNAFEE85 pKa = 4.33EE86 pKa = 4.34YY87 pKa = 10.86LPLFSVKK94 pKa = 8.6YY95 pKa = 8.28TAFFLLRR102 pKa = 11.84FTFRR106 pKa = 11.84IRR108 pKa = 11.84NDD110 pKa = 3.82RR111 pKa = 11.84IVAALEE117 pKa = 4.03SPQRR121 pKa = 11.84DD122 pKa = 3.75ATNLSYY128 pKa = 11.01SKK130 pKa = 10.87KK131 pKa = 9.87PVNTGDD137 pKa = 3.63FLDD140 pKa = 4.08IQSFPATFLSPPQSSLSRR158 pKa = 11.84RR159 pKa = 11.84DD160 pKa = 2.97IKK162 pKa = 9.09TTGKK166 pKa = 10.29ARR168 pKa = 11.84YY169 pKa = 9.06CSIFKK174 pKa = 10.83VGTTDD179 pKa = 2.9ARR181 pKa = 11.84YY182 pKa = 8.97SAIPKK187 pKa = 9.62RR188 pKa = 11.84YY189 pKa = 8.09YY190 pKa = 10.22SCPPVLQRR198 pKa = 11.84YY199 pKa = 8.68ISSTAGLPRR208 pKa = 11.84FAFVHH213 pKa = 5.51YY214 pKa = 10.57LLTLHH219 pKa = 6.25LQGRR223 pKa = 11.84RR224 pKa = 11.84DD225 pKa = 3.71QMHH228 pKa = 5.72SQCLLSRR235 pKa = 11.84YY236 pKa = 8.84CKK238 pKa = 9.37WSLGKK243 pKa = 8.97GTPSAALKK251 pKa = 10.32RR252 pKa = 11.84YY253 pKa = 9.58GGEE256 pKa = 4.16CTSHH260 pKa = 6.23IFSRR264 pKa = 11.84PSCFGCTQLRR274 pKa = 11.84KK275 pKa = 9.8LLLEE279 pKa = 3.83LHH281 pKa = 6.7PWW283 pKa = 3.36
Molecular weight: 32.37 kDa
Isoelectric point according different methods:
Peptides (in silico digests for buttom-up proteomics)
Below you can find in silico digests of the whole proteome with Trypsin, Chymotrypsin, Trypsin+LysC, LysN, ArgC proteases suitable for different mass spec machines.| Try ESI |
 |
|---|
| ChTry ESI |
 |
|---|
| ArgC ESI |
 |
|---|
| LysN ESI |
 |
|---|
| TryLysC ESI |
 |
|---|
| Try MALDI |
 |
|---|
| ChTry MALDI |
 |
|---|
| ArgC MALDI |
 |
|---|
| LysN MALDI |
 |
|---|
| TryLysC MALDI |
 |
|---|
| Try LTQ |
 |
|---|
| ChTry LTQ |
 |
|---|
| ArgC LTQ |
 |
|---|
| LysN LTQ |
 |
|---|
| TryLysC LTQ |
 |
|---|
| Try MSlow |
 |
|---|
| ChTry MSlow |
 |
|---|
| ArgC MSlow |
 |
|---|
| LysN MSlow |
 |
|---|
| TryLysC MSlow |
 |
|---|
| Try MShigh |
 |
|---|
| ChTry MShigh |
 |
|---|
| ArgC MShigh |
 |
|---|
| LysN MShigh |
 |
|---|
| TryLysC MShigh |
 |
|---|
General Statistics
Number of major isoforms |
Number of additional isoforms |
Number of all proteins |
Number of amino acids |
Min. Seq. Length |
Max. Seq. Length |
Avg. Seq. Length |
Avg. Mol. Weight |
|---|---|---|---|---|---|---|---|
0 |
952713 |
18 |
4346 |
328.2 |
36.36 |
Amino acid frequency
Ala |
Cys |
Asp |
Glu |
Phe |
Gly |
His |
Ile |
Lys |
Leu |
|---|---|---|---|---|---|---|---|---|---|
9.095 ± 0.049 | 1.487 ± 0.025 |
5.238 ± 0.042 | 6.73 ± 0.05 |
4.338 ± 0.033 | 7.545 ± 0.039 |
2.277 ± 0.021 | 5.541 ± 0.043 |
5.089 ± 0.049 | 10.618 ± 0.055 |
Met |
Asn |
Gln |
Pro |
Arg |
Ser |
Thr |
Val |
Trp |
Tyr |
|---|---|---|---|---|---|---|---|---|---|
2.73 ± 0.024 | 3.141 ± 0.032 |
4.615 ± 0.033 | 3.652 ± 0.031 |
5.809 ± 0.05 | 6.239 ± 0.038 |
5.041 ± 0.05 | 6.95 ± 0.041 |
1.194 ± 0.018 | 2.67 ± 0.026 |
Most of the basic statistics you can see at this page can be downloaded from this CSV file
Proteome-pI is available under Creative Commons Attribution-NoDerivs license, for more details see here
| Reference: Kozlowski LP. Proteome-pI 2.0: Proteome Isoelectric Point Database Update. Nucleic Acids Res. 2021, doi: 10.1093/nar/gkab944 | Contact: Lukasz P. Kozlowski |
