Leptonema illini DSM 21528
Taxonomy: cellular organisms; Bacteria; Spirochaetes; Spirochaetia; Leptospirales; Leptospiraceae; Leptonema; Leptonema illini
Average proteome isoelectric point is 6.65
Get precalculated fractions of proteins

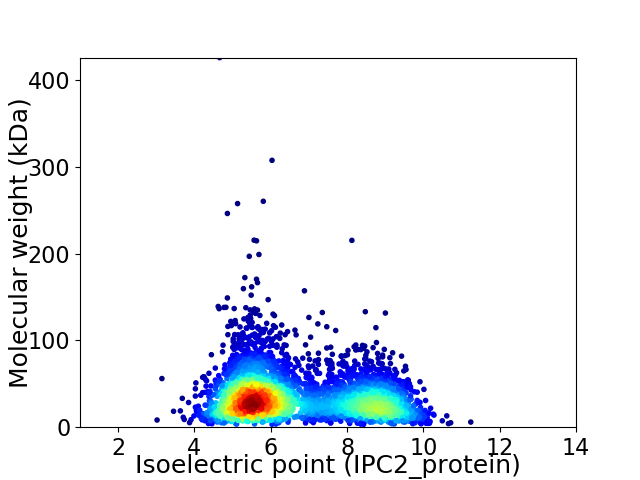
Virtual 2D-PAGE plot for 4129 proteins (isoelectric point calculated using IPC2_protein)
Get csv file with sequences according to given criteria:
* You can choose from 21 different methods for calculating isoelectric point
Summary statistics related to proteome-wise predictions


Protein with the lowest isoelectric point:
>tr|H2CF11|H2CF11_9LEPT Transposase IS4 family protein OS=Leptonema illini DSM 21528 OX=929563 GN=Lepil_0913 PE=4 SV=1
MM1 pKa = 7.47LLFVSVLSACPAGGGGDD18 pKa = 3.79AFLPPPGLTSGGTTTCPADD37 pKa = 3.23AWPFDD42 pKa = 3.58TGAYY46 pKa = 10.02LADD49 pKa = 4.39FVTEE53 pKa = 4.38APGEE57 pKa = 4.27TGGTFGNSLCAVNGVYY73 pKa = 10.85GNGLNRR79 pKa = 11.84GSGDD83 pKa = 3.6VYY85 pKa = 10.82SLKK88 pKa = 10.65SSPASTLCEE97 pKa = 4.0ANEE100 pKa = 3.96KK101 pKa = 10.79CIVLEE106 pKa = 3.85WAGRR110 pKa = 11.84RR111 pKa = 11.84VLSGAGADD119 pKa = 3.24FVVFEE124 pKa = 4.51NPFNRR129 pKa = 11.84TSGGRR134 pKa = 11.84FVEE137 pKa = 4.2AVIVEE142 pKa = 4.13VSQDD146 pKa = 3.22GTVWCGWNPAYY157 pKa = 9.74TGEE160 pKa = 4.28TDD162 pKa = 2.95SGAAQFSLDD171 pKa = 3.31IYY173 pKa = 11.36DD174 pKa = 3.44VAKK177 pKa = 10.62YY178 pKa = 10.87DD179 pKa = 3.93DD180 pKa = 3.94VAGLEE185 pKa = 4.07PVLFNQSTWTGTATDD200 pKa = 3.64VFDD203 pKa = 3.58VAKK206 pKa = 10.82AGGDD210 pKa = 3.59HH211 pKa = 7.32FDD213 pKa = 4.25LADD216 pKa = 3.87LVASGSCDD224 pKa = 3.12AGTVSAIQASGFVYY238 pKa = 10.71LRR240 pKa = 11.84MTTGNSRR247 pKa = 11.84SPASFPLPGDD257 pKa = 3.88SFDD260 pKa = 3.52QTGDD264 pKa = 2.75IDD266 pKa = 4.41GVVARR271 pKa = 11.84NVDD274 pKa = 3.41DD275 pKa = 3.86RR276 pKa = 5.34
MM1 pKa = 7.47LLFVSVLSACPAGGGGDD18 pKa = 3.79AFLPPPGLTSGGTTTCPADD37 pKa = 3.23AWPFDD42 pKa = 3.58TGAYY46 pKa = 10.02LADD49 pKa = 4.39FVTEE53 pKa = 4.38APGEE57 pKa = 4.27TGGTFGNSLCAVNGVYY73 pKa = 10.85GNGLNRR79 pKa = 11.84GSGDD83 pKa = 3.6VYY85 pKa = 10.82SLKK88 pKa = 10.65SSPASTLCEE97 pKa = 4.0ANEE100 pKa = 3.96KK101 pKa = 10.79CIVLEE106 pKa = 3.85WAGRR110 pKa = 11.84RR111 pKa = 11.84VLSGAGADD119 pKa = 3.24FVVFEE124 pKa = 4.51NPFNRR129 pKa = 11.84TSGGRR134 pKa = 11.84FVEE137 pKa = 4.2AVIVEE142 pKa = 4.13VSQDD146 pKa = 3.22GTVWCGWNPAYY157 pKa = 9.74TGEE160 pKa = 4.28TDD162 pKa = 2.95SGAAQFSLDD171 pKa = 3.31IYY173 pKa = 11.36DD174 pKa = 3.44VAKK177 pKa = 10.62YY178 pKa = 10.87DD179 pKa = 3.93DD180 pKa = 3.94VAGLEE185 pKa = 4.07PVLFNQSTWTGTATDD200 pKa = 3.64VFDD203 pKa = 3.58VAKK206 pKa = 10.82AGGDD210 pKa = 3.59HH211 pKa = 7.32FDD213 pKa = 4.25LADD216 pKa = 3.87LVASGSCDD224 pKa = 3.12AGTVSAIQASGFVYY238 pKa = 10.71LRR240 pKa = 11.84MTTGNSRR247 pKa = 11.84SPASFPLPGDD257 pKa = 3.88SFDD260 pKa = 3.52QTGDD264 pKa = 2.75IDD266 pKa = 4.41GVVARR271 pKa = 11.84NVDD274 pKa = 3.41DD275 pKa = 3.86RR276 pKa = 5.34
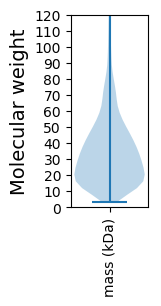
Molecular weight: 28.46 kDa
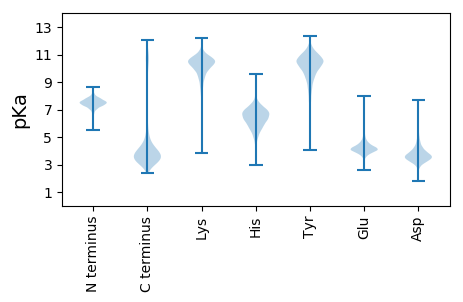
Isoelectric point according different methods:
Protein with the highest isoelectric point:
>tr|H2CGQ2|H2CGQ2_9LEPT Activator of Hsp90 ATPase 1 family protein OS=Leptonema illini DSM 21528 OX=929563 GN=Lepil_0015 PE=4 SV=1
MM1 pKa = 7.43KK2 pKa = 9.61RR3 pKa = 11.84TFQPGNISRR12 pKa = 11.84LRR14 pKa = 11.84THH16 pKa = 6.75GFRR19 pKa = 11.84SRR21 pKa = 11.84MSTSGGRR28 pKa = 11.84KK29 pKa = 8.58VLANRR34 pKa = 11.84RR35 pKa = 11.84KK36 pKa = 9.12KK37 pKa = 10.61GRR39 pKa = 11.84MRR41 pKa = 11.84LTVSSSTHH49 pKa = 5.58RR50 pKa = 11.84KK51 pKa = 8.72
MM1 pKa = 7.43KK2 pKa = 9.61RR3 pKa = 11.84TFQPGNISRR12 pKa = 11.84LRR14 pKa = 11.84THH16 pKa = 6.75GFRR19 pKa = 11.84SRR21 pKa = 11.84MSTSGGRR28 pKa = 11.84KK29 pKa = 8.58VLANRR34 pKa = 11.84RR35 pKa = 11.84KK36 pKa = 9.12KK37 pKa = 10.61GRR39 pKa = 11.84MRR41 pKa = 11.84LTVSSSTHH49 pKa = 5.58RR50 pKa = 11.84KK51 pKa = 8.72
Molecular weight: 5.91 kDa
Isoelectric point according different methods:
Peptides (in silico digests for buttom-up proteomics)
Below you can find in silico digests of the whole proteome with Trypsin, Chymotrypsin, Trypsin+LysC, LysN, ArgC proteases suitable for different mass spec machines.| Try ESI |
 |
|---|
| ChTry ESI |
 |
|---|
| ArgC ESI |
 |
|---|
| LysN ESI |
 |
|---|
| TryLysC ESI |
 |
|---|
| Try MALDI |
 |
|---|
| ChTry MALDI |
 |
|---|
| ArgC MALDI |
 |
|---|
| LysN MALDI |
 |
|---|
| TryLysC MALDI |
 |
|---|
| Try LTQ |
 |
|---|
| ChTry LTQ |
 |
|---|
| ArgC LTQ |
 |
|---|
| LysN LTQ |
 |
|---|
| TryLysC LTQ |
 |
|---|
| Try MSlow |
 |
|---|
| ChTry MSlow |
 |
|---|
| ArgC MSlow |
 |
|---|
| LysN MSlow |
 |
|---|
| TryLysC MSlow |
 |
|---|
| Try MShigh |
 |
|---|
| ChTry MShigh |
 |
|---|
| ArgC MShigh |
 |
|---|
| LysN MShigh |
 |
|---|
| TryLysC MShigh |
 |
|---|
General Statistics
Number of major isoforms |
Number of additional isoforms |
Number of all proteins |
Number of amino acids |
Min. Seq. Length |
Max. Seq. Length |
Avg. Seq. Length |
Avg. Mol. Weight |
|---|---|---|---|---|---|---|---|
0 |
1346542 |
30 |
3820 |
326.1 |
36.5 |
Amino acid frequency
Ala |
Cys |
Asp |
Glu |
Phe |
Gly |
His |
Ile |
Lys |
Leu |
|---|---|---|---|---|---|---|---|---|---|
8.686 ± 0.043 | 0.858 ± 0.013 |
5.546 ± 0.029 | 6.825 ± 0.037 |
4.65 ± 0.029 | 7.204 ± 0.034 |
2.128 ± 0.018 | 6.088 ± 0.031 |
4.495 ± 0.036 | 10.683 ± 0.045 |
Met |
Asn |
Gln |
Pro |
Arg |
Ser |
Thr |
Val |
Trp |
Tyr |
|---|---|---|---|---|---|---|---|---|---|
2.47 ± 0.016 | 3.099 ± 0.02 |
4.499 ± 0.024 | 3.389 ± 0.023 |
7.222 ± 0.041 | 6.568 ± 0.035 |
4.941 ± 0.031 | 6.404 ± 0.033 |
1.112 ± 0.015 | 3.133 ± 0.024 |
Most of the basic statistics you can see at this page can be downloaded from this CSV file
Proteome-pI is available under Creative Commons Attribution-NoDerivs license, for more details see here
| Reference: Kozlowski LP. Proteome-pI 2.0: Proteome Isoelectric Point Database Update. Nucleic Acids Res. 2021, doi: 10.1093/nar/gkab944 | Contact: Lukasz P. Kozlowski |
