Tolypothrix bouteillei VB521301
Taxonomy: cellular organisms; Bacteria; Terrabacteria group; Cyanobacteria/Melainabacteria group; Cyanobacteria; Nostocales; Tolypothrichaceae; Tolypothrix; Tolypothrix bouteillei
Average proteome isoelectric point is 6.46
Get precalculated fractions of proteins

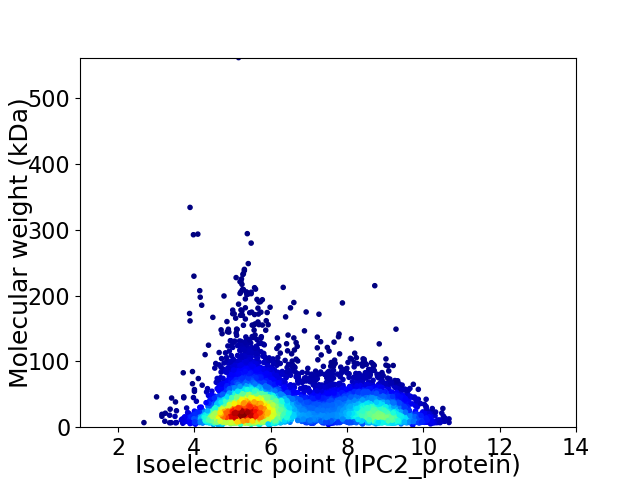
Virtual 2D-PAGE plot for 7755 proteins (isoelectric point calculated using IPC2_protein)
Get csv file with sequences according to given criteria:
* You can choose from 21 different methods for calculating isoelectric point
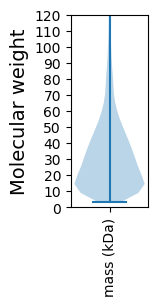
Summary statistics related to proteome-wise predictions


Protein with the lowest isoelectric point:
>tr|A0A0C1QYQ7|A0A0C1QYQ7_9CYAN Urease accessory protein UreF OS=Tolypothrix bouteillei VB521301 OX=1479485 GN=ureF PE=3 SV=1
MM1 pKa = 7.87EE2 pKa = 4.26IQFRR6 pKa = 11.84EE7 pKa = 3.67IDD9 pKa = 4.12PFNVWIWLKK18 pKa = 10.74FSTVPSRR25 pKa = 11.84QEE27 pKa = 3.21RR28 pKa = 11.84QYY30 pKa = 10.75IEE32 pKa = 4.56EE33 pKa = 4.48VFDD36 pKa = 3.1SWFYY40 pKa = 10.95LGKK43 pKa = 10.68LGGFNAEE50 pKa = 3.91NLQVQEE56 pKa = 4.17TGVNLSYY63 pKa = 10.29MDD65 pKa = 4.38YY66 pKa = 11.1DD67 pKa = 3.59SEE69 pKa = 6.01GYY71 pKa = 9.9DD72 pKa = 3.18KK73 pKa = 11.83SMLALMHH80 pKa = 6.36NMGEE84 pKa = 4.21VEE86 pKa = 5.4YY87 pKa = 9.83EE88 pKa = 4.33GTWARR93 pKa = 11.84CWFDD97 pKa = 4.96LGTADD102 pKa = 6.27AIALDD107 pKa = 3.68ILINALKK114 pKa = 10.04QLSAEE119 pKa = 4.2YY120 pKa = 9.4VTIEE124 pKa = 3.58QLYY127 pKa = 10.33IGGEE131 pKa = 4.03NEE133 pKa = 3.99DD134 pKa = 3.76WPVEE138 pKa = 3.94NSDD141 pKa = 3.83NLNSFVFDD149 pKa = 3.59NN150 pKa = 4.19
MM1 pKa = 7.87EE2 pKa = 4.26IQFRR6 pKa = 11.84EE7 pKa = 3.67IDD9 pKa = 4.12PFNVWIWLKK18 pKa = 10.74FSTVPSRR25 pKa = 11.84QEE27 pKa = 3.21RR28 pKa = 11.84QYY30 pKa = 10.75IEE32 pKa = 4.56EE33 pKa = 4.48VFDD36 pKa = 3.1SWFYY40 pKa = 10.95LGKK43 pKa = 10.68LGGFNAEE50 pKa = 3.91NLQVQEE56 pKa = 4.17TGVNLSYY63 pKa = 10.29MDD65 pKa = 4.38YY66 pKa = 11.1DD67 pKa = 3.59SEE69 pKa = 6.01GYY71 pKa = 9.9DD72 pKa = 3.18KK73 pKa = 11.83SMLALMHH80 pKa = 6.36NMGEE84 pKa = 4.21VEE86 pKa = 5.4YY87 pKa = 9.83EE88 pKa = 4.33GTWARR93 pKa = 11.84CWFDD97 pKa = 4.96LGTADD102 pKa = 6.27AIALDD107 pKa = 3.68ILINALKK114 pKa = 10.04QLSAEE119 pKa = 4.2YY120 pKa = 9.4VTIEE124 pKa = 3.58QLYY127 pKa = 10.33IGGEE131 pKa = 4.03NEE133 pKa = 3.99DD134 pKa = 3.76WPVEE138 pKa = 3.94NSDD141 pKa = 3.83NLNSFVFDD149 pKa = 3.59NN150 pKa = 4.19
Molecular weight: 17.5 kDa
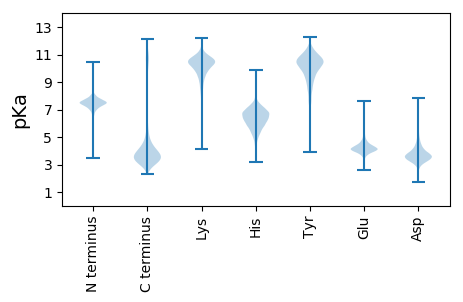
Isoelectric point according different methods:
Protein with the highest isoelectric point:
>tr|A0A0C1R2N5|A0A0C1R2N5_9CYAN ABC transporter ATP-binding protein OS=Tolypothrix bouteillei VB521301 OX=1479485 GN=DA73_0213770 PE=4 SV=1
PP1 pKa = 7.42GGAKK5 pKa = 10.06VPSDD9 pKa = 3.28VTLLVEE15 pKa = 5.03SGPLLQMIPPGVLYY29 pKa = 10.65SVLLFRR35 pKa = 11.84VHH37 pKa = 6.48AVAIVRR43 pKa = 11.84AQLVPSPRR51 pKa = 11.84YY52 pKa = 9.17VPPLAAHH59 pKa = 6.1CVGRR63 pKa = 11.84STTQLCGVRR72 pKa = 11.84FGRR75 pKa = 11.84QQAPNDD81 pKa = 3.88PVGASAICSWRR92 pKa = 11.84RR93 pKa = 11.84MLVVSGAGGVPPWAVIFAKK112 pKa = 10.54LNKK115 pKa = 9.84LWAQYY120 pKa = 11.17NFVRR124 pKa = 11.84VDD126 pKa = 4.01FSSS129 pKa = 2.91
PP1 pKa = 7.42GGAKK5 pKa = 10.06VPSDD9 pKa = 3.28VTLLVEE15 pKa = 5.03SGPLLQMIPPGVLYY29 pKa = 10.65SVLLFRR35 pKa = 11.84VHH37 pKa = 6.48AVAIVRR43 pKa = 11.84AQLVPSPRR51 pKa = 11.84YY52 pKa = 9.17VPPLAAHH59 pKa = 6.1CVGRR63 pKa = 11.84STTQLCGVRR72 pKa = 11.84FGRR75 pKa = 11.84QQAPNDD81 pKa = 3.88PVGASAICSWRR92 pKa = 11.84RR93 pKa = 11.84MLVVSGAGGVPPWAVIFAKK112 pKa = 10.54LNKK115 pKa = 9.84LWAQYY120 pKa = 11.17NFVRR124 pKa = 11.84VDD126 pKa = 4.01FSSS129 pKa = 2.91
Molecular weight: 13.82 kDa
Isoelectric point according different methods:
Peptides (in silico digests for buttom-up proteomics)
Below you can find in silico digests of the whole proteome with Trypsin, Chymotrypsin, Trypsin+LysC, LysN, ArgC proteases suitable for different mass spec machines.| Try ESI |
 |
|---|
| ChTry ESI |
 |
|---|
| ArgC ESI |
 |
|---|
| LysN ESI |
 |
|---|
| TryLysC ESI |
 |
|---|
| Try MALDI |
 |
|---|
| ChTry MALDI |
 |
|---|
| ArgC MALDI |
 |
|---|
| LysN MALDI |
 |
|---|
| TryLysC MALDI |
 |
|---|
| Try LTQ |
 |
|---|
| ChTry LTQ |
 |
|---|
| ArgC LTQ |
 |
|---|
| LysN LTQ |
 |
|---|
| TryLysC LTQ |
 |
|---|
| Try MSlow |
 |
|---|
| ChTry MSlow |
 |
|---|
| ArgC MSlow |
 |
|---|
| LysN MSlow |
 |
|---|
| TryLysC MSlow |
 |
|---|
| Try MShigh |
 |
|---|
| ChTry MShigh |
 |
|---|
| ArgC MShigh |
 |
|---|
| LysN MShigh |
 |
|---|
| TryLysC MShigh |
 |
|---|
General Statistics
Number of major isoforms |
Number of additional isoforms |
Number of all proteins |
Number of amino acids |
Min. Seq. Length |
Max. Seq. Length |
Avg. Seq. Length |
Avg. Mol. Weight |
|---|---|---|---|---|---|---|---|
2420647 |
31 |
4999 |
312.1 |
34.83 |
Amino acid frequency
Ala |
Cys |
Asp |
Glu |
Phe |
Gly |
His |
Ile |
Lys |
Leu |
|---|---|---|---|---|---|---|---|---|---|
7.97 ± 0.03 | 1.004 ± 0.011 |
4.763 ± 0.022 | 6.348 ± 0.026 |
3.995 ± 0.018 | 6.599 ± 0.03 |
1.844 ± 0.017 | 6.579 ± 0.021 |
4.964 ± 0.027 | 10.949 ± 0.034 |
Met |
Asn |
Gln |
Pro |
Arg |
Ser |
Thr |
Val |
Trp |
Tyr |
|---|---|---|---|---|---|---|---|---|---|
1.799 ± 0.012 | 4.371 ± 0.027 |
4.623 ± 0.023 | 5.248 ± 0.026 |
5.27 ± 0.022 | 6.626 ± 0.024 |
5.735 ± 0.022 | 6.813 ± 0.023 |
1.423 ± 0.012 | 3.07 ± 0.02 |
Most of the basic statistics you can see at this page can be downloaded from this CSV file
Proteome-pI is available under Creative Commons Attribution-NoDerivs license, for more details see here
| Reference: Kozlowski LP. Proteome-pI 2.0: Proteome Isoelectric Point Database Update. Nucleic Acids Res. 2021, doi: 10.1093/nar/gkab944 | Contact: Lukasz P. Kozlowski |
