Streptomyces sp. NRRL WC-3618
Taxonomy: cellular organisms; Bacteria; Terrabacteria group; Actinobacteria; Actinomycetia; Streptomycetales; Streptomycetaceae; Streptomyces; unclassified Streptomyces
Average proteome isoelectric point is 6.3
Get precalculated fractions of proteins

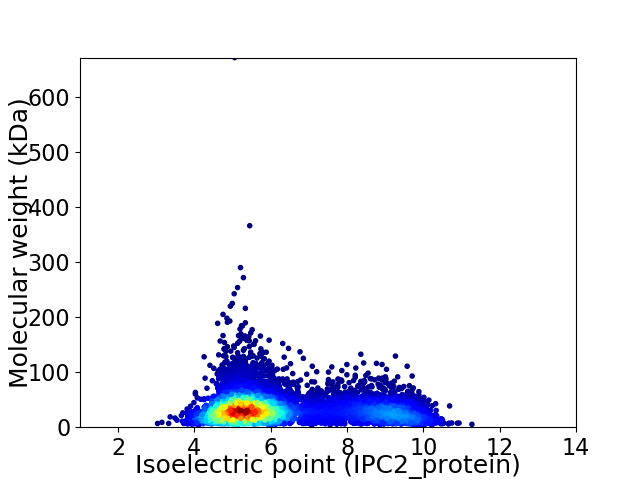
Virtual 2D-PAGE plot for 7314 proteins (isoelectric point calculated using IPC2_protein)
Get csv file with sequences according to given criteria:
* You can choose from 21 different methods for calculating isoelectric point
Summary statistics related to proteome-wise predictions


Protein with the lowest isoelectric point:
>tr|A0A0N0SY61|A0A0N0SY61_9ACTN HATPase_c domain-containing protein OS=Streptomyces sp. NRRL WC-3618 OX=1519490 GN=ADL01_32270 PE=4 SV=1
MM1 pKa = 7.32TAPTDD6 pKa = 3.7STSALLPTPAAAEE19 pKa = 3.98PPPLSFNVPEE29 pKa = 4.74GFFALPLAATPEE41 pKa = 4.04EE42 pKa = 4.17RR43 pKa = 11.84AEE45 pKa = 3.92RR46 pKa = 11.84AQTFVRR52 pKa = 11.84ALYY55 pKa = 10.73SGGDD59 pKa = 3.49DD60 pKa = 4.63TIWEE64 pKa = 4.17PAAPYY69 pKa = 9.31YY70 pKa = 10.76AAIAEE75 pKa = 4.31LMAGTGVSYY84 pKa = 11.01AAMGLFSTADD94 pKa = 3.5DD95 pKa = 4.51EE96 pKa = 5.58GDD98 pKa = 3.57GDD100 pKa = 3.89EE101 pKa = 4.8SGDD104 pKa = 3.72VARR107 pKa = 11.84HH108 pKa = 5.2SLSDD112 pKa = 3.56GAAQCAFTVAAIPTDD127 pKa = 3.52QAAADD132 pKa = 4.04TDD134 pKa = 3.83IVAQGILATLSRR146 pKa = 11.84DD147 pKa = 3.61PYY149 pKa = 11.62NDD151 pKa = 3.59ARR153 pKa = 11.84WLDD156 pKa = 4.34LPCGPAVFCVTMRR169 pKa = 11.84KK170 pKa = 9.48LKK172 pKa = 10.66LSPDD176 pKa = 3.3VTASGEE182 pKa = 4.24ATDD185 pKa = 5.34LLAGQIQVHH194 pKa = 5.55VPFPTGPFTAIFTLYY209 pKa = 9.45TASTEE214 pKa = 4.09YY215 pKa = 9.86WAEE218 pKa = 3.93FCDD221 pKa = 3.95MMAAILQTVSFAEE234 pKa = 4.22PLAGTDD240 pKa = 3.87ALPVIAGG247 pKa = 3.6
MM1 pKa = 7.32TAPTDD6 pKa = 3.7STSALLPTPAAAEE19 pKa = 3.98PPPLSFNVPEE29 pKa = 4.74GFFALPLAATPEE41 pKa = 4.04EE42 pKa = 4.17RR43 pKa = 11.84AEE45 pKa = 3.92RR46 pKa = 11.84AQTFVRR52 pKa = 11.84ALYY55 pKa = 10.73SGGDD59 pKa = 3.49DD60 pKa = 4.63TIWEE64 pKa = 4.17PAAPYY69 pKa = 9.31YY70 pKa = 10.76AAIAEE75 pKa = 4.31LMAGTGVSYY84 pKa = 11.01AAMGLFSTADD94 pKa = 3.5DD95 pKa = 4.51EE96 pKa = 5.58GDD98 pKa = 3.57GDD100 pKa = 3.89EE101 pKa = 4.8SGDD104 pKa = 3.72VARR107 pKa = 11.84HH108 pKa = 5.2SLSDD112 pKa = 3.56GAAQCAFTVAAIPTDD127 pKa = 3.52QAAADD132 pKa = 4.04TDD134 pKa = 3.83IVAQGILATLSRR146 pKa = 11.84DD147 pKa = 3.61PYY149 pKa = 11.62NDD151 pKa = 3.59ARR153 pKa = 11.84WLDD156 pKa = 4.34LPCGPAVFCVTMRR169 pKa = 11.84KK170 pKa = 9.48LKK172 pKa = 10.66LSPDD176 pKa = 3.3VTASGEE182 pKa = 4.24ATDD185 pKa = 5.34LLAGQIQVHH194 pKa = 5.55VPFPTGPFTAIFTLYY209 pKa = 9.45TASTEE214 pKa = 4.09YY215 pKa = 9.86WAEE218 pKa = 3.93FCDD221 pKa = 3.95MMAAILQTVSFAEE234 pKa = 4.22PLAGTDD240 pKa = 3.87ALPVIAGG247 pKa = 3.6
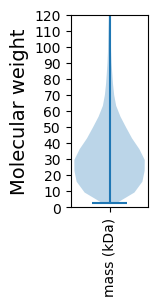
Molecular weight: 25.73 kDa
Isoelectric point according different methods:
Protein with the highest isoelectric point:
>tr|A0A0M8V8A4|A0A0M8V8A4_9ACTN Membrane protein OS=Streptomyces sp. NRRL WC-3618 OX=1519490 GN=ADL01_32795 PE=4 SV=1
MM1 pKa = 7.69SKK3 pKa = 9.0RR4 pKa = 11.84TFQPNNRR11 pKa = 11.84RR12 pKa = 11.84RR13 pKa = 11.84AKK15 pKa = 8.7THH17 pKa = 5.15GFRR20 pKa = 11.84LRR22 pKa = 11.84MRR24 pKa = 11.84TRR26 pKa = 11.84AGRR29 pKa = 11.84AILANRR35 pKa = 11.84RR36 pKa = 11.84GKK38 pKa = 10.51GRR40 pKa = 11.84ASLSAA45 pKa = 3.83
MM1 pKa = 7.69SKK3 pKa = 9.0RR4 pKa = 11.84TFQPNNRR11 pKa = 11.84RR12 pKa = 11.84RR13 pKa = 11.84AKK15 pKa = 8.7THH17 pKa = 5.15GFRR20 pKa = 11.84LRR22 pKa = 11.84MRR24 pKa = 11.84TRR26 pKa = 11.84AGRR29 pKa = 11.84AILANRR35 pKa = 11.84RR36 pKa = 11.84GKK38 pKa = 10.51GRR40 pKa = 11.84ASLSAA45 pKa = 3.83
Molecular weight: 5.21 kDa
Isoelectric point according different methods:
Peptides (in silico digests for buttom-up proteomics)
Below you can find in silico digests of the whole proteome with Trypsin, Chymotrypsin, Trypsin+LysC, LysN, ArgC proteases suitable for different mass spec machines.| Try ESI |
 |
|---|
| ChTry ESI |
 |
|---|
| ArgC ESI |
 |
|---|
| LysN ESI |
 |
|---|
| TryLysC ESI |
 |
|---|
| Try MALDI |
 |
|---|
| ChTry MALDI |
 |
|---|
| ArgC MALDI |
 |
|---|
| LysN MALDI |
 |
|---|
| TryLysC MALDI |
 |
|---|
| Try LTQ |
 |
|---|
| ChTry LTQ |
 |
|---|
| ArgC LTQ |
 |
|---|
| LysN LTQ |
 |
|---|
| TryLysC LTQ |
 |
|---|
| Try MSlow |
 |
|---|
| ChTry MSlow |
 |
|---|
| ArgC MSlow |
 |
|---|
| LysN MSlow |
 |
|---|
| TryLysC MSlow |
 |
|---|
| Try MShigh |
 |
|---|
| ChTry MShigh |
 |
|---|
| ArgC MShigh |
 |
|---|
| LysN MShigh |
 |
|---|
| TryLysC MShigh |
 |
|---|
General Statistics
Number of major isoforms |
Number of additional isoforms |
Number of all proteins |
Number of amino acids |
Min. Seq. Length |
Max. Seq. Length |
Avg. Seq. Length |
Avg. Mol. Weight |
|---|---|---|---|---|---|---|---|
0 |
2386731 |
21 |
6357 |
326.3 |
34.99 |
Amino acid frequency
Ala |
Cys |
Asp |
Glu |
Phe |
Gly |
His |
Ile |
Lys |
Leu |
|---|---|---|---|---|---|---|---|---|---|
13.209 ± 0.043 | 0.793 ± 0.008 |
6.056 ± 0.023 | 5.647 ± 0.029 |
2.77 ± 0.016 | 9.382 ± 0.027 |
2.301 ± 0.012 | 3.182 ± 0.018 |
2.274 ± 0.024 | 10.218 ± 0.036 |
Met |
Asn |
Gln |
Pro |
Arg |
Ser |
Thr |
Val |
Trp |
Tyr |
|---|---|---|---|---|---|---|---|---|---|
1.728 ± 0.012 | 1.932 ± 0.017 |
5.94 ± 0.026 | 2.869 ± 0.018 |
7.807 ± 0.03 | 5.278 ± 0.023 |
6.348 ± 0.023 | 8.517 ± 0.027 |
1.576 ± 0.013 | 2.17 ± 0.015 |
Most of the basic statistics you can see at this page can be downloaded from this CSV file
Proteome-pI is available under Creative Commons Attribution-NoDerivs license, for more details see here
| Reference: Kozlowski LP. Proteome-pI 2.0: Proteome Isoelectric Point Database Update. Nucleic Acids Res. 2021, doi: 10.1093/nar/gkab944 | Contact: Lukasz P. Kozlowski |
