Cronobacter phage ENT47670
Taxonomy: Viruses; Duplodnaviria; Heunggongvirae; Uroviricota; Caudoviricetes; Caudovirales; Siphoviridae; unclassified Siphoviridae
Average proteome isoelectric point is 6.66
Get precalculated fractions of proteins
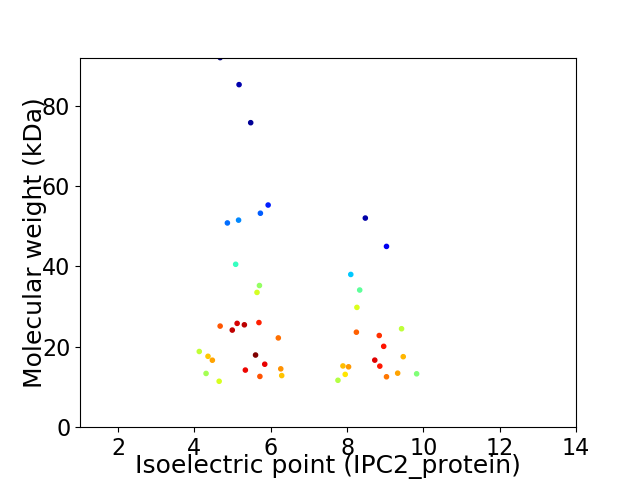
Virtual 2D-PAGE plot for 46 proteins (isoelectric point calculated using IPC2_protein)
Get csv file with sequences according to given criteria:
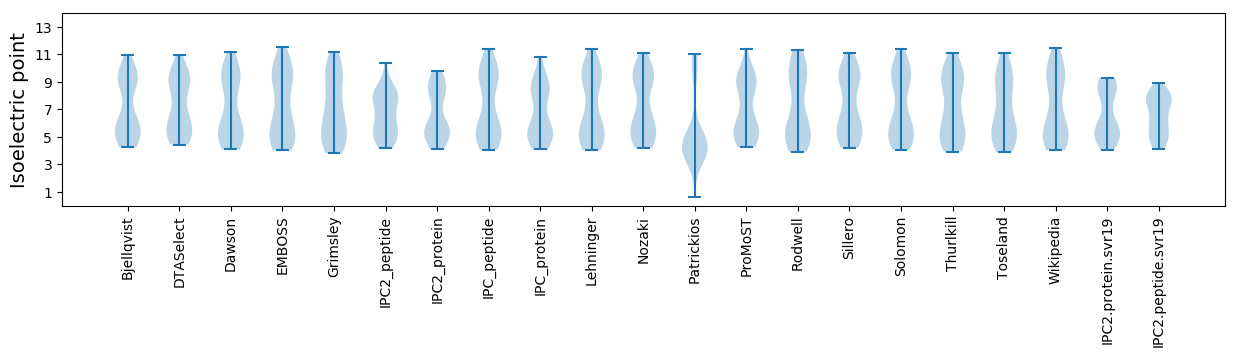
* You can choose from 21 different methods for calculating isoelectric point
Summary statistics related to proteome-wise predictions
Protein with the lowest isoelectric point:
>tr|F1C5E3|F1C5E3_9CAUD Uncharacterized protein OS=Cronobacter phage ENT47670 OX=984186 PE=4 SV=1
MM1 pKa = 8.11AITPITAAQVKK12 pKa = 9.02QQLSSLGYY20 pKa = 9.71SIPDD24 pKa = 4.35FIIDD28 pKa = 4.38AYY30 pKa = 10.7LCKK33 pKa = 10.42LSSIEE38 pKa = 3.93QCLEE42 pKa = 3.36ASGYY46 pKa = 9.39DD47 pKa = 3.25EE48 pKa = 5.48CDD50 pKa = 3.12VVLIQVYY57 pKa = 9.73AVSLMALTAYY67 pKa = 8.81SQRR70 pKa = 11.84IKK72 pKa = 10.78SQSAPSGASRR82 pKa = 11.84SFDD85 pKa = 3.3YY86 pKa = 11.12TGDD89 pKa = 3.68VLSMRR94 pKa = 11.84DD95 pKa = 3.49ALLSLDD101 pKa = 4.29KK102 pKa = 11.08SGCTASLPIDD112 pKa = 3.48VGSRR116 pKa = 11.84VGFFDD121 pKa = 4.66VVGGCC126 pKa = 4.15
MM1 pKa = 8.11AITPITAAQVKK12 pKa = 9.02QQLSSLGYY20 pKa = 9.71SIPDD24 pKa = 4.35FIIDD28 pKa = 4.38AYY30 pKa = 10.7LCKK33 pKa = 10.42LSSIEE38 pKa = 3.93QCLEE42 pKa = 3.36ASGYY46 pKa = 9.39DD47 pKa = 3.25EE48 pKa = 5.48CDD50 pKa = 3.12VVLIQVYY57 pKa = 9.73AVSLMALTAYY67 pKa = 8.81SQRR70 pKa = 11.84IKK72 pKa = 10.78SQSAPSGASRR82 pKa = 11.84SFDD85 pKa = 3.3YY86 pKa = 11.12TGDD89 pKa = 3.68VLSMRR94 pKa = 11.84DD95 pKa = 3.49ALLSLDD101 pKa = 4.29KK102 pKa = 11.08SGCTASLPIDD112 pKa = 3.48VGSRR116 pKa = 11.84VGFFDD121 pKa = 4.66VVGGCC126 pKa = 4.15
Molecular weight: 13.38 kDa
Isoelectric point according different methods:
Protein with the highest isoelectric point:
>tr|F1C5C1|F1C5C1_9CAUD Uncharacterized protein OS=Cronobacter phage ENT47670 OX=984186 PE=4 SV=1
MM1 pKa = 7.64RR2 pKa = 11.84KK3 pKa = 9.97SNATYY8 pKa = 10.07AAKK11 pKa = 10.56ALLRR15 pKa = 11.84LPFTVAMAMKK25 pKa = 10.16SCATNAITTFTTLMMKK41 pKa = 10.05ARR43 pKa = 11.84KK44 pKa = 8.82LKK46 pKa = 9.3PSARR50 pKa = 11.84RR51 pKa = 11.84SEE53 pKa = 3.8WSGLNVASGCRR64 pKa = 11.84KK65 pKa = 9.52RR66 pKa = 11.84MQSSRR71 pKa = 11.84CSHH74 pKa = 6.9ASRR77 pKa = 11.84VATYY81 pKa = 9.69RR82 pKa = 11.84LCIILKK88 pKa = 9.97DD89 pKa = 3.7DD90 pKa = 4.13GMTHH94 pKa = 6.74TEE96 pKa = 3.95LCQFARR102 pKa = 11.84MLPTGCHH109 pKa = 5.2SLPRR113 pKa = 11.84QLNSSRR119 pKa = 3.65
MM1 pKa = 7.64RR2 pKa = 11.84KK3 pKa = 9.97SNATYY8 pKa = 10.07AAKK11 pKa = 10.56ALLRR15 pKa = 11.84LPFTVAMAMKK25 pKa = 10.16SCATNAITTFTTLMMKK41 pKa = 10.05ARR43 pKa = 11.84KK44 pKa = 8.82LKK46 pKa = 9.3PSARR50 pKa = 11.84RR51 pKa = 11.84SEE53 pKa = 3.8WSGLNVASGCRR64 pKa = 11.84KK65 pKa = 9.52RR66 pKa = 11.84MQSSRR71 pKa = 11.84CSHH74 pKa = 6.9ASRR77 pKa = 11.84VATYY81 pKa = 9.69RR82 pKa = 11.84LCIILKK88 pKa = 9.97DD89 pKa = 3.7DD90 pKa = 4.13GMTHH94 pKa = 6.74TEE96 pKa = 3.95LCQFARR102 pKa = 11.84MLPTGCHH109 pKa = 5.2SLPRR113 pKa = 11.84QLNSSRR119 pKa = 3.65
Molecular weight: 13.29 kDa
Isoelectric point according different methods:
Peptides (in silico digests for buttom-up proteomics)
Below you can find in silico digests of the whole proteome with Trypsin, Chymotrypsin, Trypsin+LysC, LysN, ArgC proteases suitable for different mass spec machines.| Try ESI |
 |
|---|
| ChTry ESI |
|
|---|
| ArgC ESI |
|
|---|
| LysN ESI |
|
|---|
| TryLysC ESI |
|
|---|
| Try MALDI |
|
|---|
| ChTry MALDI |
|
|---|
| ArgC MALDI |
|
|---|
| LysN MALDI |
|
|---|
| TryLysC MALDI |
|
|---|
| Try LTQ |
|
|---|
| ChTry LTQ |
|
|---|
| ArgC LTQ |
|
|---|
| LysN LTQ |
|
|---|
| TryLysC LTQ |
|
|---|
| Try MSlow |
|
|---|
| ChTry MSlow |
|
|---|
| ArgC MSlow |
|
|---|
| LysN MSlow |
|
|---|
| TryLysC MSlow |
|
|---|
| Try MShigh |
|
|---|
| ChTry MShigh |
|
|---|
| ArgC MShigh |
|
|---|
| LysN MShigh |
|
|---|
| TryLysC MShigh |
|
|---|
General Statistics
Number of major isoforms |
Number of additional isoforms |
Number of all proteins |
Number of amino acids |
Min. Seq. Length |
Max. Seq. Length |
Avg. Seq. Length |
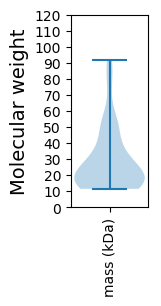
Avg. Mol. Weight |
|---|---|---|---|---|---|---|---|
0 |
11892 |
102 |
825 |
258.5 |
28.74 |
Amino acid frequency
Ala |
Cys |
Asp |
Glu |
Phe |
Gly |
His |
Ile |
Lys |
Leu |
|---|---|---|---|---|---|---|---|---|---|
9.612 ± 0.739 | 1.144 ± 0.175 |
5.743 ± 0.277 | 6.029 ± 0.416 |
3.557 ± 0.289 | 6.778 ± 0.338 |
1.623 ± 0.213 | 5.642 ± 0.26 |
5.155 ± 0.368 | 8.022 ± 0.306 |
Met |
Asn |
Gln |
Pro |
Arg |
Ser |
Thr |
Val |
Trp |
Tyr |
|---|---|---|---|---|---|---|---|---|---|
2.598 ± 0.202 | 4.6 ± 0.253 |
3.809 ± 0.256 | 4.549 ± 0.404 |
6.088 ± 0.381 | 6.971 ± 0.461 |
6.054 ± 0.415 | 7.173 ± 0.342 |
1.589 ± 0.15 | 3.263 ± 0.269 |
Most of the basic statistics you can see at this page can be downloaded from this CSV file
See this proteome in:

Proteome-pI is available under Creative Commons Attribution-NoDerivs license, for more details see here
| Reference: Kozlowski LP. Proteome-pI 2.0: Proteome Isoelectric Point Database Update. Nucleic Acids Res. 2021, doi: 10.1093/nar/gkab944 | Contact: Lukasz P. Kozlowski |