Paracoccus sp. 228
Taxonomy: cellular organisms; Bacteria; Proteobacteria; Alphaproteobacteria; Rhodobacterales; Rhodobacteraceae; Paracoccus; unclassified Paracoccus
Average proteome isoelectric point is 6.38
Get precalculated fractions of proteins

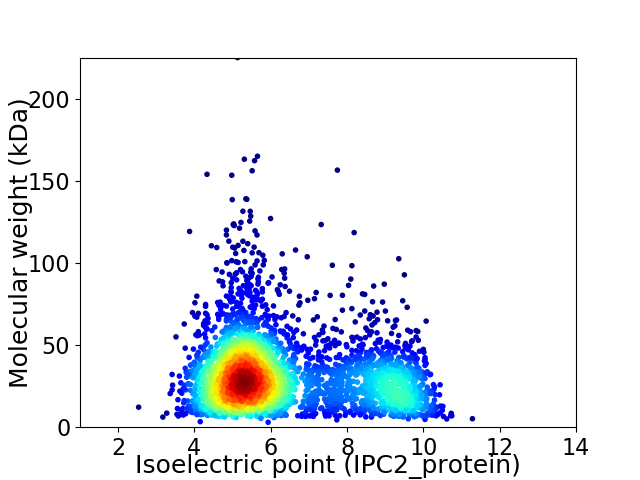
Virtual 2D-PAGE plot for 3463 proteins (isoelectric point calculated using IPC2_protein)
Get csv file with sequences according to given criteria:
* You can choose from 21 different methods for calculating isoelectric point
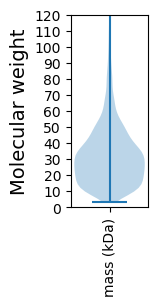
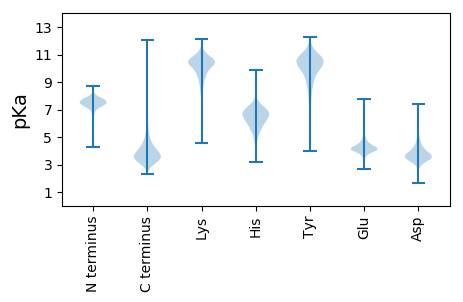
Summary statistics related to proteome-wise predictions


Protein with the lowest isoelectric point:
>tr|A0A0D6TAR2|A0A0D6TAR2_9RHOB Protein-methionine-sulfoxide reductase catalytic subunit MsrP OS=Paracoccus sp. 228 OX=1192054 GN=msrP PE=3 SV=1
MM1 pKa = 7.48KK2 pKa = 10.09KK3 pKa = 10.59ALIASTALVLTAGIAAADD21 pKa = 3.89VTISGYY27 pKa = 10.89GRR29 pKa = 11.84TGVLYY34 pKa = 10.56QEE36 pKa = 4.84GGVRR40 pKa = 11.84GPIDD44 pKa = 3.64TNGDD48 pKa = 3.51APGGLVDD55 pKa = 4.87ASDD58 pKa = 5.51AIVQSRR64 pKa = 11.84LRR66 pKa = 11.84MNIDD70 pKa = 2.93ATTSTDD76 pKa = 3.03QGVDD80 pKa = 3.57FGGRR84 pKa = 11.84IRR86 pKa = 11.84IQWDD90 pKa = 3.02QGDD93 pKa = 4.56DD94 pKa = 3.65EE95 pKa = 4.85TTVAPGYY102 pKa = 10.73VYY104 pKa = 9.67VTASGLTVEE113 pKa = 5.0IGNSNTAYY121 pKa = 10.68DD122 pKa = 4.06SAALLYY128 pKa = 10.25NSEE131 pKa = 3.83IGVYY135 pKa = 9.93SRR137 pKa = 11.84SFGNSRR143 pKa = 11.84GDD145 pKa = 3.32FFAYY149 pKa = 8.89NTDD152 pKa = 3.82GYY154 pKa = 8.15PTLANVVDD162 pKa = 4.18GAIDD166 pKa = 3.47RR167 pKa = 11.84RR168 pKa = 11.84SDD170 pKa = 3.35YY171 pKa = 10.08MGVMVKK177 pKa = 10.39YY178 pKa = 10.29AVAGVNLRR186 pKa = 11.84ASVIDD191 pKa = 3.77PDD193 pKa = 3.9QVYY196 pKa = 10.72DD197 pKa = 4.13LPTDD201 pKa = 3.64TSEE204 pKa = 4.48KK205 pKa = 9.34EE206 pKa = 4.02YY207 pKa = 10.96SVSADD212 pKa = 3.61YY213 pKa = 11.03VWNDD217 pKa = 3.07SVTLSAAYY225 pKa = 9.62VKK227 pKa = 10.72NGAGIDD233 pKa = 4.31DD234 pKa = 3.91NDD236 pKa = 3.6QYY238 pKa = 11.76FVGAEE243 pKa = 3.72YY244 pKa = 11.08AFNDD248 pKa = 3.54KK249 pKa = 10.56TDD251 pKa = 3.0IGLLYY256 pKa = 9.8IDD258 pKa = 4.27NGEE261 pKa = 4.19VLGDD265 pKa = 4.07DD266 pKa = 3.7SDD268 pKa = 4.03LGKK271 pKa = 9.27TITLYY276 pKa = 11.02GSYY279 pKa = 9.9EE280 pKa = 4.09VAPLTTINGYY290 pKa = 8.14VANNSADD297 pKa = 3.74SNEE300 pKa = 3.89SDD302 pKa = 3.24NAFGIGGAYY311 pKa = 10.22DD312 pKa = 3.52LGGAMLAGSVQRR324 pKa = 11.84GYY326 pKa = 11.26DD327 pKa = 3.56EE328 pKa = 6.24NITADD333 pKa = 3.29MGVQFNFF340 pKa = 3.6
MM1 pKa = 7.48KK2 pKa = 10.09KK3 pKa = 10.59ALIASTALVLTAGIAAADD21 pKa = 3.89VTISGYY27 pKa = 10.89GRR29 pKa = 11.84TGVLYY34 pKa = 10.56QEE36 pKa = 4.84GGVRR40 pKa = 11.84GPIDD44 pKa = 3.64TNGDD48 pKa = 3.51APGGLVDD55 pKa = 4.87ASDD58 pKa = 5.51AIVQSRR64 pKa = 11.84LRR66 pKa = 11.84MNIDD70 pKa = 2.93ATTSTDD76 pKa = 3.03QGVDD80 pKa = 3.57FGGRR84 pKa = 11.84IRR86 pKa = 11.84IQWDD90 pKa = 3.02QGDD93 pKa = 4.56DD94 pKa = 3.65EE95 pKa = 4.85TTVAPGYY102 pKa = 10.73VYY104 pKa = 9.67VTASGLTVEE113 pKa = 5.0IGNSNTAYY121 pKa = 10.68DD122 pKa = 4.06SAALLYY128 pKa = 10.25NSEE131 pKa = 3.83IGVYY135 pKa = 9.93SRR137 pKa = 11.84SFGNSRR143 pKa = 11.84GDD145 pKa = 3.32FFAYY149 pKa = 8.89NTDD152 pKa = 3.82GYY154 pKa = 8.15PTLANVVDD162 pKa = 4.18GAIDD166 pKa = 3.47RR167 pKa = 11.84RR168 pKa = 11.84SDD170 pKa = 3.35YY171 pKa = 10.08MGVMVKK177 pKa = 10.39YY178 pKa = 10.29AVAGVNLRR186 pKa = 11.84ASVIDD191 pKa = 3.77PDD193 pKa = 3.9QVYY196 pKa = 10.72DD197 pKa = 4.13LPTDD201 pKa = 3.64TSEE204 pKa = 4.48KK205 pKa = 9.34EE206 pKa = 4.02YY207 pKa = 10.96SVSADD212 pKa = 3.61YY213 pKa = 11.03VWNDD217 pKa = 3.07SVTLSAAYY225 pKa = 9.62VKK227 pKa = 10.72NGAGIDD233 pKa = 4.31DD234 pKa = 3.91NDD236 pKa = 3.6QYY238 pKa = 11.76FVGAEE243 pKa = 3.72YY244 pKa = 11.08AFNDD248 pKa = 3.54KK249 pKa = 10.56TDD251 pKa = 3.0IGLLYY256 pKa = 9.8IDD258 pKa = 4.27NGEE261 pKa = 4.19VLGDD265 pKa = 4.07DD266 pKa = 3.7SDD268 pKa = 4.03LGKK271 pKa = 9.27TITLYY276 pKa = 11.02GSYY279 pKa = 9.9EE280 pKa = 4.09VAPLTTINGYY290 pKa = 8.14VANNSADD297 pKa = 3.74SNEE300 pKa = 3.89SDD302 pKa = 3.24NAFGIGGAYY311 pKa = 10.22DD312 pKa = 3.52LGGAMLAGSVQRR324 pKa = 11.84GYY326 pKa = 11.26DD327 pKa = 3.56EE328 pKa = 6.24NITADD333 pKa = 3.29MGVQFNFF340 pKa = 3.6
Molecular weight: 35.94 kDa
Isoelectric point according different methods:
Protein with the highest isoelectric point:
>tr|A0A0D6TE65|A0A0D6TE65_9RHOB ABC transporter substrate-binding protein OS=Paracoccus sp. 228 OX=1192054 GN=SY26_06145 PE=4 SV=1
MM1 pKa = 7.45KK2 pKa = 9.61RR3 pKa = 11.84TFQPSNLVRR12 pKa = 11.84ARR14 pKa = 11.84RR15 pKa = 11.84HH16 pKa = 4.37GFRR19 pKa = 11.84ARR21 pKa = 11.84MATKK25 pKa = 10.39GGRR28 pKa = 11.84LVLNRR33 pKa = 11.84RR34 pKa = 11.84RR35 pKa = 11.84AKK37 pKa = 9.7GRR39 pKa = 11.84KK40 pKa = 8.85RR41 pKa = 11.84LSAA44 pKa = 3.96
MM1 pKa = 7.45KK2 pKa = 9.61RR3 pKa = 11.84TFQPSNLVRR12 pKa = 11.84ARR14 pKa = 11.84RR15 pKa = 11.84HH16 pKa = 4.37GFRR19 pKa = 11.84ARR21 pKa = 11.84MATKK25 pKa = 10.39GGRR28 pKa = 11.84LVLNRR33 pKa = 11.84RR34 pKa = 11.84RR35 pKa = 11.84AKK37 pKa = 9.7GRR39 pKa = 11.84KK40 pKa = 8.85RR41 pKa = 11.84LSAA44 pKa = 3.96
Molecular weight: 5.16 kDa
Isoelectric point according different methods:
Peptides (in silico digests for buttom-up proteomics)
Below you can find in silico digests of the whole proteome with Trypsin, Chymotrypsin, Trypsin+LysC, LysN, ArgC proteases suitable for different mass spec machines.| Try ESI |
 |
|---|
| ChTry ESI |
 |
|---|
| ArgC ESI |
 |
|---|
| LysN ESI |
 |
|---|
| TryLysC ESI |
 |
|---|
| Try MALDI |
 |
|---|
| ChTry MALDI |
 |
|---|
| ArgC MALDI |
 |
|---|
| LysN MALDI |
 |
|---|
| TryLysC MALDI |
 |
|---|
| Try LTQ |
 |
|---|
| ChTry LTQ |
 |
|---|
| ArgC LTQ |
 |
|---|
| LysN LTQ |
 |
|---|
| TryLysC LTQ |
 |
|---|
| Try MSlow |
 |
|---|
| ChTry MSlow |
 |
|---|
| ArgC MSlow |
 |
|---|
| LysN MSlow |
 |
|---|
| TryLysC MSlow |
 |
|---|
| Try MShigh |
 |
|---|
| ChTry MShigh |
 |
|---|
| ArgC MShigh |
 |
|---|
| LysN MShigh |
 |
|---|
| TryLysC MShigh |
 |
|---|
General Statistics
Number of major isoforms |
Number of additional isoforms |
Number of all proteins |
Number of amino acids |
Min. Seq. Length |
Max. Seq. Length |
Avg. Seq. Length |
Avg. Mol. Weight |
|---|---|---|---|---|---|---|---|
0 |
1070115 |
28 |
2108 |
309.0 |
33.37 |
Amino acid frequency
Ala |
Cys |
Asp |
Glu |
Phe |
Gly |
His |
Ile |
Lys |
Leu |
|---|---|---|---|---|---|---|---|---|---|
13.467 ± 0.067 | 0.803 ± 0.011 |
6.449 ± 0.04 | 4.904 ± 0.044 |
3.402 ± 0.027 | 8.861 ± 0.045 |
2.106 ± 0.021 | 5.035 ± 0.029 |
2.288 ± 0.036 | 10.372 ± 0.049 |
Met |
Asn |
Gln |
Pro |
Arg |
Ser |
Thr |
Val |
Trp |
Tyr |
|---|---|---|---|---|---|---|---|---|---|
2.882 ± 0.02 | 2.206 ± 0.021 |
5.421 ± 0.028 | 3.53 ± 0.023 |
7.513 ± 0.043 | 4.674 ± 0.027 |
5.434 ± 0.028 | 7.257 ± 0.036 |
1.457 ± 0.02 | 1.933 ± 0.021 |
Most of the basic statistics you can see at this page can be downloaded from this CSV file
Proteome-pI is available under Creative Commons Attribution-NoDerivs license, for more details see here
| Reference: Kozlowski LP. Proteome-pI 2.0: Proteome Isoelectric Point Database Update. Nucleic Acids Res. 2021, doi: 10.1093/nar/gkab944 | Contact: Lukasz P. Kozlowski |
