Pseudomonas virus PMG1
Taxonomy: Viruses; Duplodnaviria; Heunggongvirae; Uroviricota; Caudoviricetes; Caudovirales; Siphoviridae; Detrevirus
Average proteome isoelectric point is 6.75
Get precalculated fractions of proteins

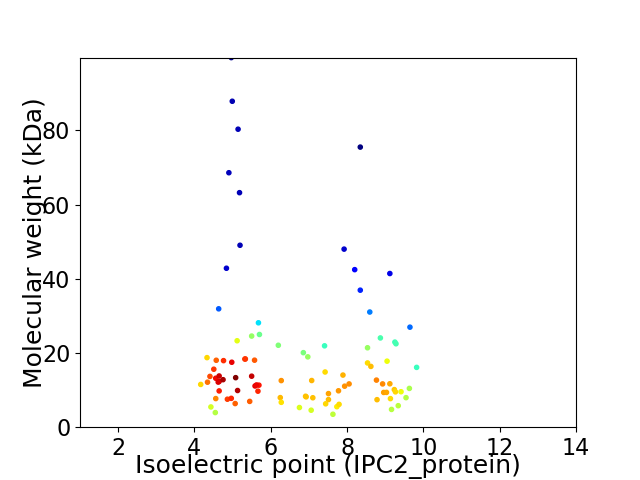
Virtual 2D-PAGE plot for 96 proteins (isoelectric point calculated using IPC2_protein)
Get csv file with sequences according to given criteria:
* You can choose from 21 different methods for calculating isoelectric point
Summary statistics related to proteome-wise predictions


Protein with the lowest isoelectric point:
>tr|H2BDB4|H2BDB4_9CAUD Putative head-tail adaptor OS=Pseudomonas virus PMG1 OX=1129146 GN=PMG1_00010 PE=4 SV=1
MM1 pKa = 7.59SLIPLDD7 pKa = 3.8TAKK10 pKa = 10.94SFLDD14 pKa = 5.15VIHH17 pKa = 7.24DD18 pKa = 3.59WDD20 pKa = 4.08DD21 pKa = 3.7AKK23 pKa = 11.25LQLLLDD29 pKa = 4.12GAEE32 pKa = 4.76DD33 pKa = 3.88EE34 pKa = 5.24ACQFMWRR41 pKa = 11.84QSLDD45 pKa = 3.35GLCNCEE51 pKa = 4.01EE52 pKa = 4.13SSEE55 pKa = 4.32AVSSEE60 pKa = 3.78PGLPPSVVIGVLLLLQASYY79 pKa = 10.58QAAPDD84 pKa = 4.13EE85 pKa = 4.36IATLRR90 pKa = 11.84KK91 pKa = 9.05AAEE94 pKa = 4.35VKK96 pKa = 10.42LMPYY100 pKa = 10.05RR101 pKa = 11.84CGLGVV106 pKa = 3.15
MM1 pKa = 7.59SLIPLDD7 pKa = 3.8TAKK10 pKa = 10.94SFLDD14 pKa = 5.15VIHH17 pKa = 7.24DD18 pKa = 3.59WDD20 pKa = 4.08DD21 pKa = 3.7AKK23 pKa = 11.25LQLLLDD29 pKa = 4.12GAEE32 pKa = 4.76DD33 pKa = 3.88EE34 pKa = 5.24ACQFMWRR41 pKa = 11.84QSLDD45 pKa = 3.35GLCNCEE51 pKa = 4.01EE52 pKa = 4.13SSEE55 pKa = 4.32AVSSEE60 pKa = 3.78PGLPPSVVIGVLLLLQASYY79 pKa = 10.58QAAPDD84 pKa = 4.13EE85 pKa = 4.36IATLRR90 pKa = 11.84KK91 pKa = 9.05AAEE94 pKa = 4.35VKK96 pKa = 10.42LMPYY100 pKa = 10.05RR101 pKa = 11.84CGLGVV106 pKa = 3.15
Molecular weight: 11.52 kDa
Isoelectric point according different methods:
Protein with the highest isoelectric point:
>tr|H2BDG2|H2BDG2_9CAUD Uncharacterized protein OS=Pseudomonas virus PMG1 OX=1129146 GN=PMG1_00058 PE=4 SV=1
MM1 pKa = 7.3TSSTTHH7 pKa = 6.3NATSSRR13 pKa = 11.84EE14 pKa = 4.2SASGRR19 pKa = 11.84SPFAAPAGQMIDD31 pKa = 3.23LFGPVPVLANLSPRR45 pKa = 11.84QAKK48 pKa = 9.66EE49 pKa = 3.65LGLMTRR55 pKa = 11.84VISGHH60 pKa = 5.97ILPGSSASAALEE72 pKa = 3.8KK73 pKa = 11.0SLVSRR78 pKa = 11.84LQARR82 pKa = 11.84TRR84 pKa = 11.84SLGSTLYY91 pKa = 11.07KK92 pKa = 9.82LTWKK96 pKa = 8.85PWSMPSGLLRR106 pKa = 11.84SRR108 pKa = 11.84LRR110 pKa = 11.84ASVPRR115 pKa = 11.84TSEE118 pKa = 3.59TGRR121 pKa = 11.84TGWGTPSARR130 pKa = 11.84DD131 pKa = 3.46WKK133 pKa = 10.55SASATEE139 pKa = 3.82EE140 pKa = 3.9WLAGRR145 pKa = 11.84LEE147 pKa = 4.08HH148 pKa = 7.38SRR150 pKa = 11.84GKK152 pKa = 9.62PLSEE156 pKa = 4.3QAFTLAGWPTCTANDD171 pKa = 3.47AEE173 pKa = 4.51KK174 pKa = 10.28RR175 pKa = 11.84GKK177 pKa = 9.93VSYY180 pKa = 10.67RR181 pKa = 11.84EE182 pKa = 3.9NAPNGLNAIATLSGPARR199 pKa = 11.84LTASGQMLTGSSAGMEE215 pKa = 4.14SGGQLNPAHH224 pKa = 6.44SRR226 pKa = 11.84WLMGLPPEE234 pKa = 4.61WDD236 pKa = 2.8ACAPTEE242 pKa = 4.2TPSMLKK248 pKa = 10.0RR249 pKa = 11.84RR250 pKa = 11.84RR251 pKa = 11.84SSS253 pKa = 2.86
MM1 pKa = 7.3TSSTTHH7 pKa = 6.3NATSSRR13 pKa = 11.84EE14 pKa = 4.2SASGRR19 pKa = 11.84SPFAAPAGQMIDD31 pKa = 3.23LFGPVPVLANLSPRR45 pKa = 11.84QAKK48 pKa = 9.66EE49 pKa = 3.65LGLMTRR55 pKa = 11.84VISGHH60 pKa = 5.97ILPGSSASAALEE72 pKa = 3.8KK73 pKa = 11.0SLVSRR78 pKa = 11.84LQARR82 pKa = 11.84TRR84 pKa = 11.84SLGSTLYY91 pKa = 11.07KK92 pKa = 9.82LTWKK96 pKa = 8.85PWSMPSGLLRR106 pKa = 11.84SRR108 pKa = 11.84LRR110 pKa = 11.84ASVPRR115 pKa = 11.84TSEE118 pKa = 3.59TGRR121 pKa = 11.84TGWGTPSARR130 pKa = 11.84DD131 pKa = 3.46WKK133 pKa = 10.55SASATEE139 pKa = 3.82EE140 pKa = 3.9WLAGRR145 pKa = 11.84LEE147 pKa = 4.08HH148 pKa = 7.38SRR150 pKa = 11.84GKK152 pKa = 9.62PLSEE156 pKa = 4.3QAFTLAGWPTCTANDD171 pKa = 3.47AEE173 pKa = 4.51KK174 pKa = 10.28RR175 pKa = 11.84GKK177 pKa = 9.93VSYY180 pKa = 10.67RR181 pKa = 11.84EE182 pKa = 3.9NAPNGLNAIATLSGPARR199 pKa = 11.84LTASGQMLTGSSAGMEE215 pKa = 4.14SGGQLNPAHH224 pKa = 6.44SRR226 pKa = 11.84WLMGLPPEE234 pKa = 4.61WDD236 pKa = 2.8ACAPTEE242 pKa = 4.2TPSMLKK248 pKa = 10.0RR249 pKa = 11.84RR250 pKa = 11.84RR251 pKa = 11.84SSS253 pKa = 2.86
Molecular weight: 26.96 kDa
Isoelectric point according different methods:
Peptides (in silico digests for buttom-up proteomics)
Below you can find in silico digests of the whole proteome with Trypsin, Chymotrypsin, Trypsin+LysC, LysN, ArgC proteases suitable for different mass spec machines.| Try ESI |
 |
|---|
| ChTry ESI |
 |
|---|
| ArgC ESI |
 |
|---|
| LysN ESI |
 |
|---|
| TryLysC ESI |
 |
|---|
| Try MALDI |
 |
|---|
| ChTry MALDI |
 |
|---|
| ArgC MALDI |
 |
|---|
| LysN MALDI |
 |
|---|
| TryLysC MALDI |
 |
|---|
| Try LTQ |
 |
|---|
| ChTry LTQ |
 |
|---|
| ArgC LTQ |
 |
|---|
| LysN LTQ |
 |
|---|
| TryLysC LTQ |
 |
|---|
| Try MSlow |
 |
|---|
| ChTry MSlow |
 |
|---|
| ArgC MSlow |
 |
|---|
| LysN MSlow |
 |
|---|
| TryLysC MSlow |
 |
|---|
| Try MShigh |
 |
|---|
| ChTry MShigh |
 |
|---|
| ArgC MShigh |
 |
|---|
| LysN MShigh |
 |
|---|
| TryLysC MShigh |
 |
|---|
General Statistics
Number of major isoforms |
Number of additional isoforms |
Number of all proteins |
Number of amino acids |
Min. Seq. Length |
Max. Seq. Length |
Avg. Seq. Length |
Avg. Mol. Weight |
|---|---|---|---|---|---|---|---|
0 |
16729 |
31 |
909 |
174.3 |
19.27 |
Amino acid frequency
Ala |
Cys |
Asp |
Glu |
Phe |
Gly |
His |
Ile |
Lys |
Leu |
|---|---|---|---|---|---|---|---|---|---|
10.975 ± 0.482 | 1.739 ± 0.178 |
5.47 ± 0.237 | 6.671 ± 0.299 |
3.294 ± 0.194 | 7.604 ± 0.229 |
1.955 ± 0.17 | 5.374 ± 0.261 |
4.507 ± 0.268 | 8.584 ± 0.278 |
Met |
Asn |
Gln |
Pro |
Arg |
Ser |
Thr |
Val |
Trp |
Tyr |
|---|---|---|---|---|---|---|---|---|---|
2.552 ± 0.154 | 3.294 ± 0.191 |
4.561 ± 0.242 | 3.79 ± 0.221 |
7.084 ± 0.286 | 6.504 ± 0.319 |
4.836 ± 0.27 | 6.516 ± 0.246 |
1.805 ± 0.135 | 2.887 ± 0.198 |
Most of the basic statistics you can see at this page can be downloaded from this CSV file
Proteome-pI is available under Creative Commons Attribution-NoDerivs license, for more details see here
| Reference: Kozlowski LP. Proteome-pI 2.0: Proteome Isoelectric Point Database Update. Nucleic Acids Res. 2021, doi: 10.1093/nar/gkab944 | Contact: Lukasz P. Kozlowski |
