Pseudoclavibacter endophyticus
Taxonomy: cellular organisms; Bacteria; Terrabacteria group; Actinobacteria; Actinomycetia; Micrococcales; Microbacteriaceae; Pseudoclavibacter
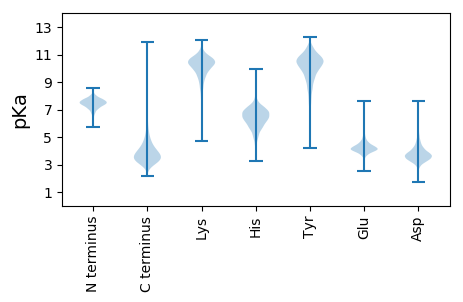
Average proteome isoelectric point is 6.0
Get precalculated fractions of proteins

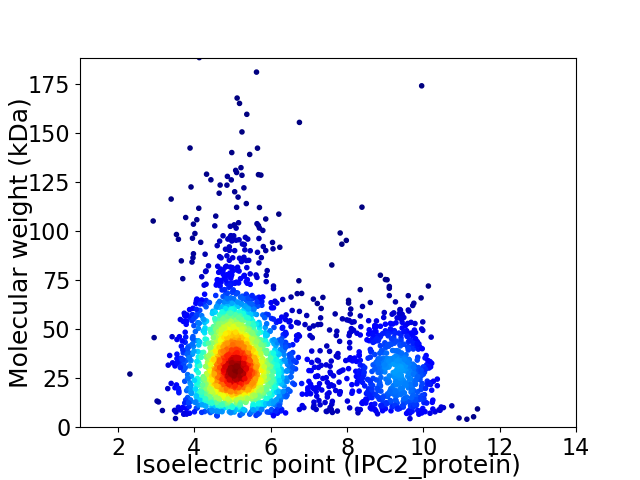
Virtual 2D-PAGE plot for 2822 proteins (isoelectric point calculated using IPC2_protein)
Get csv file with sequences according to given criteria:
* You can choose from 21 different methods for calculating isoelectric point
Summary statistics related to proteome-wise predictions


Protein with the lowest isoelectric point:
>tr|A0A6H9WQS1|A0A6H9WQS1_9MICO ABC transporter substrate-binding protein OS=Pseudoclavibacter endophyticus OX=1778590 GN=F8O04_02310 PE=4 SV=1
MM1 pKa = 7.23TRR3 pKa = 11.84LGPAIACLVALAVALAGCSHH23 pKa = 7.29ANPAGAGAADD33 pKa = 4.31GADD36 pKa = 3.63AAPGTAAADD45 pKa = 3.58TGGAGAGLDD54 pKa = 3.72VYY56 pKa = 10.97ATTGYY61 pKa = 10.42LADD64 pKa = 5.74AIANIAPGATVTTMVGPGGDD84 pKa = 3.55PHH86 pKa = 6.14THH88 pKa = 5.38QPSTRR93 pKa = 11.84DD94 pKa = 2.85IEE96 pKa = 5.21AILDD100 pKa = 3.69ADD102 pKa = 3.94VVFWNGLHH110 pKa = 7.07LEE112 pKa = 4.14AQMVDD117 pKa = 3.11QLTSLGDD124 pKa = 3.34RR125 pKa = 11.84QLAVGDD131 pKa = 4.03RR132 pKa = 11.84LPDD135 pKa = 3.67GVLLDD140 pKa = 4.33WPDD143 pKa = 3.12TDD145 pKa = 4.74ADD147 pKa = 4.04GNALHH152 pKa = 7.45DD153 pKa = 3.7PHH155 pKa = 7.77VWNSPTAWSLVVGLIADD172 pKa = 4.19KK173 pKa = 11.12LSALDD178 pKa = 4.02PSDD181 pKa = 3.42AATYY185 pKa = 9.6AANADD190 pKa = 3.69AYY192 pKa = 9.93VAEE195 pKa = 4.48IASAAEE201 pKa = 3.69NAEE204 pKa = 4.08RR205 pKa = 11.84MLATVPEE212 pKa = 4.18PRR214 pKa = 11.84ILITGHH220 pKa = 6.98DD221 pKa = 3.45AFNYY225 pKa = 10.02FGATYY230 pKa = 10.69DD231 pKa = 3.75LDD233 pKa = 4.28VYY235 pKa = 10.77ATDD238 pKa = 4.76FVSSDD243 pKa = 3.28AALSPQEE250 pKa = 3.99LSGLAGLIAEE260 pKa = 4.57HH261 pKa = 5.52QVPVIFMDD269 pKa = 3.71NQANPQAITSLQEE282 pKa = 3.54AVQARR287 pKa = 11.84GWQVAVADD295 pKa = 4.04AEE297 pKa = 4.58LYY299 pKa = 10.82ADD301 pKa = 4.22SLGAEE306 pKa = 4.48PGVDD310 pKa = 3.01TYY312 pKa = 11.75LGVLAHH318 pKa = 6.49NAAAIADD325 pKa = 4.0ALGEE329 pKa = 4.2EE330 pKa = 4.7PAA332 pKa = 4.79
MM1 pKa = 7.23TRR3 pKa = 11.84LGPAIACLVALAVALAGCSHH23 pKa = 7.29ANPAGAGAADD33 pKa = 4.31GADD36 pKa = 3.63AAPGTAAADD45 pKa = 3.58TGGAGAGLDD54 pKa = 3.72VYY56 pKa = 10.97ATTGYY61 pKa = 10.42LADD64 pKa = 5.74AIANIAPGATVTTMVGPGGDD84 pKa = 3.55PHH86 pKa = 6.14THH88 pKa = 5.38QPSTRR93 pKa = 11.84DD94 pKa = 2.85IEE96 pKa = 5.21AILDD100 pKa = 3.69ADD102 pKa = 3.94VVFWNGLHH110 pKa = 7.07LEE112 pKa = 4.14AQMVDD117 pKa = 3.11QLTSLGDD124 pKa = 3.34RR125 pKa = 11.84QLAVGDD131 pKa = 4.03RR132 pKa = 11.84LPDD135 pKa = 3.67GVLLDD140 pKa = 4.33WPDD143 pKa = 3.12TDD145 pKa = 4.74ADD147 pKa = 4.04GNALHH152 pKa = 7.45DD153 pKa = 3.7PHH155 pKa = 7.77VWNSPTAWSLVVGLIADD172 pKa = 4.19KK173 pKa = 11.12LSALDD178 pKa = 4.02PSDD181 pKa = 3.42AATYY185 pKa = 9.6AANADD190 pKa = 3.69AYY192 pKa = 9.93VAEE195 pKa = 4.48IASAAEE201 pKa = 3.69NAEE204 pKa = 4.08RR205 pKa = 11.84MLATVPEE212 pKa = 4.18PRR214 pKa = 11.84ILITGHH220 pKa = 6.98DD221 pKa = 3.45AFNYY225 pKa = 10.02FGATYY230 pKa = 10.69DD231 pKa = 3.75LDD233 pKa = 4.28VYY235 pKa = 10.77ATDD238 pKa = 4.76FVSSDD243 pKa = 3.28AALSPQEE250 pKa = 3.99LSGLAGLIAEE260 pKa = 4.57HH261 pKa = 5.52QVPVIFMDD269 pKa = 3.71NQANPQAITSLQEE282 pKa = 3.54AVQARR287 pKa = 11.84GWQVAVADD295 pKa = 4.04AEE297 pKa = 4.58LYY299 pKa = 10.82ADD301 pKa = 4.22SLGAEE306 pKa = 4.48PGVDD310 pKa = 3.01TYY312 pKa = 11.75LGVLAHH318 pKa = 6.49NAAAIADD325 pKa = 4.0ALGEE329 pKa = 4.2EE330 pKa = 4.7PAA332 pKa = 4.79
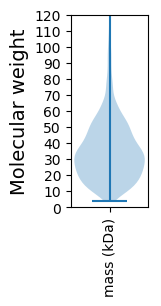
Molecular weight: 33.78 kDa
Isoelectric point according different methods:
Protein with the highest isoelectric point:
>tr|A0A6H9WRD1|A0A6H9WRD1_9MICO WYL domain-containing protein OS=Pseudoclavibacter endophyticus OX=1778590 GN=F8O04_08330 PE=4 SV=1
MM1 pKa = 7.69SKK3 pKa = 9.0RR4 pKa = 11.84TFQPNNRR11 pKa = 11.84RR12 pKa = 11.84RR13 pKa = 11.84AKK15 pKa = 9.45VHH17 pKa = 5.31GFRR20 pKa = 11.84LRR22 pKa = 11.84MRR24 pKa = 11.84TRR26 pKa = 11.84AGRR29 pKa = 11.84AILSARR35 pKa = 11.84RR36 pKa = 11.84RR37 pKa = 11.84KK38 pKa = 9.75GRR40 pKa = 11.84AKK42 pKa = 10.68LSAA45 pKa = 3.92
MM1 pKa = 7.69SKK3 pKa = 9.0RR4 pKa = 11.84TFQPNNRR11 pKa = 11.84RR12 pKa = 11.84RR13 pKa = 11.84AKK15 pKa = 9.45VHH17 pKa = 5.31GFRR20 pKa = 11.84LRR22 pKa = 11.84MRR24 pKa = 11.84TRR26 pKa = 11.84AGRR29 pKa = 11.84AILSARR35 pKa = 11.84RR36 pKa = 11.84RR37 pKa = 11.84KK38 pKa = 9.75GRR40 pKa = 11.84AKK42 pKa = 10.68LSAA45 pKa = 3.92
Molecular weight: 5.32 kDa
Isoelectric point according different methods:
Peptides (in silico digests for buttom-up proteomics)
Below you can find in silico digests of the whole proteome with Trypsin, Chymotrypsin, Trypsin+LysC, LysN, ArgC proteases suitable for different mass spec machines.| Try ESI |
 |
|---|
| ChTry ESI |
 |
|---|
| ArgC ESI |
 |
|---|
| LysN ESI |
 |
|---|
| TryLysC ESI |
 |
|---|
| Try MALDI |
 |
|---|
| ChTry MALDI |
 |
|---|
| ArgC MALDI |
 |
|---|
| LysN MALDI |
 |
|---|
| TryLysC MALDI |
 |
|---|
| Try LTQ |
 |
|---|
| ChTry LTQ |
 |
|---|
| ArgC LTQ |
 |
|---|
| LysN LTQ |
 |
|---|
| TryLysC LTQ |
 |
|---|
| Try MSlow |
 |
|---|
| ChTry MSlow |
 |
|---|
| ArgC MSlow |
 |
|---|
| LysN MSlow |
 |
|---|
| TryLysC MSlow |
 |
|---|
| Try MShigh |
 |
|---|
| ChTry MShigh |
 |
|---|
| ArgC MShigh |
 |
|---|
| LysN MShigh |
 |
|---|
| TryLysC MShigh |
 |
|---|
General Statistics
Number of major isoforms |
Number of additional isoforms |
Number of all proteins |
Number of amino acids |
Min. Seq. Length |
Max. Seq. Length |
Avg. Seq. Length |
Avg. Mol. Weight |
|---|---|---|---|---|---|---|---|
0 |
967923 |
32 |
1790 |
343.0 |
36.66 |
Amino acid frequency
Ala |
Cys |
Asp |
Glu |
Phe |
Gly |
His |
Ile |
Lys |
Leu |
|---|---|---|---|---|---|---|---|---|---|
13.476 ± 0.075 | 0.541 ± 0.012 |
6.375 ± 0.04 | 5.991 ± 0.044 |
3.03 ± 0.027 | 9.331 ± 0.041 |
2.074 ± 0.022 | 4.41 ± 0.033 |
1.652 ± 0.027 | 9.641 ± 0.052 |
Met |
Asn |
Gln |
Pro |
Arg |
Ser |
Thr |
Val |
Trp |
Tyr |
|---|---|---|---|---|---|---|---|---|---|
1.862 ± 0.018 | 1.968 ± 0.024 |
5.622 ± 0.036 | 2.708 ± 0.026 |
7.822 ± 0.064 | 5.54 ± 0.029 |
5.987 ± 0.038 | 8.721 ± 0.043 |
1.372 ± 0.021 | 1.875 ± 0.02 |
Most of the basic statistics you can see at this page can be downloaded from this CSV file
Proteome-pI is available under Creative Commons Attribution-NoDerivs license, for more details see here
| Reference: Kozlowski LP. Proteome-pI 2.0: Proteome Isoelectric Point Database Update. Nucleic Acids Res. 2021, doi: 10.1093/nar/gkab944 | Contact: Lukasz P. Kozlowski |
