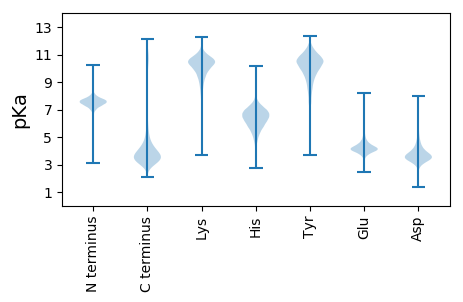
Talaromyces stipitatus (strain ATCC 10500 / CBS 375.48 / QM 6759 / NRRL 1006) (Penicillium stipitatum)
Taxonomy: cellular organisms; Eukaryota; Opisthokonta; Fungi; Dikarya; Ascomycota; saccharomyceta; Pezizomycotina; leotiomyceta; Eurotiomycetes; Eurotiomycetidae; Eurotiales; Trichocomaceae; Talaromyces; Talaromyces sect. Talaromyces; Talaromyces stipitatus
Average proteome isoelectric point is 6.53
Get precalculated fractions of proteins

Virtual 2D-PAGE plot for 13021 proteins (isoelectric point calculated using IPC2_protein)
Get csv file with sequences according to given criteria:
* You can choose from 21 different methods for calculating isoelectric point
Summary statistics related to proteome-wise predictions


Protein with the lowest isoelectric point:
>tr|B8M480|B8M480_TALSN Uncharacterized protein OS=Talaromyces stipitatus (strain ATCC 10500 / CBS 375.48 / QM 6759 / NRRL 1006) OX=441959 GN=TSTA_040170 PE=4 SV=1
MM1 pKa = 7.61KK2 pKa = 9.88STVATIAVSALLLGSQVAVANPIQKK27 pKa = 9.82RR28 pKa = 11.84DD29 pKa = 3.61IPSSFYY35 pKa = 11.27SNMAIDD41 pKa = 4.13GSIYY45 pKa = 10.78SFADD49 pKa = 3.31DD50 pKa = 4.46ASCNEE55 pKa = 3.63IFYY58 pKa = 9.22TAGSFAMASAVMSQFGASQNNEE80 pKa = 3.91LCGKK84 pKa = 8.48TIEE87 pKa = 4.12ITGANGVVQQAAIADD102 pKa = 3.94TAGADD107 pKa = 4.37IIDD110 pKa = 3.67MCLNLWEE117 pKa = 5.15DD118 pKa = 4.02FGGQDD123 pKa = 3.7GDD125 pKa = 4.04GTIMTGANGIQWRR138 pKa = 11.84LVV140 pKa = 3.2
MM1 pKa = 7.61KK2 pKa = 9.88STVATIAVSALLLGSQVAVANPIQKK27 pKa = 9.82RR28 pKa = 11.84DD29 pKa = 3.61IPSSFYY35 pKa = 11.27SNMAIDD41 pKa = 4.13GSIYY45 pKa = 10.78SFADD49 pKa = 3.31DD50 pKa = 4.46ASCNEE55 pKa = 3.63IFYY58 pKa = 9.22TAGSFAMASAVMSQFGASQNNEE80 pKa = 3.91LCGKK84 pKa = 8.48TIEE87 pKa = 4.12ITGANGVVQQAAIADD102 pKa = 3.94TAGADD107 pKa = 4.37IIDD110 pKa = 3.67MCLNLWEE117 pKa = 5.15DD118 pKa = 4.02FGGQDD123 pKa = 3.7GDD125 pKa = 4.04GTIMTGANGIQWRR138 pKa = 11.84LVV140 pKa = 3.2
Molecular weight: 14.57 kDa
Isoelectric point according different methods:
Protein with the highest isoelectric point:
>tr|B8M613|B8M613_TALSN Uncharacterized protein OS=Talaromyces stipitatus (strain ATCC 10500 / CBS 375.48 / QM 6759 / NRRL 1006) OX=441959 GN=TSTA_023480 PE=4 SV=1
MM1 pKa = 6.78VTDD4 pKa = 4.1NPCFRR9 pKa = 11.84SAVVKK14 pKa = 8.96TYY16 pKa = 10.72RR17 pKa = 11.84SDD19 pKa = 3.3RR20 pKa = 11.84TGGIHH25 pKa = 6.16VPGSNRR31 pKa = 11.84EE32 pKa = 3.89FEE34 pKa = 4.33QEE36 pKa = 3.66VEE38 pKa = 4.08YY39 pKa = 10.83AIASTRR45 pKa = 11.84FSSRR49 pKa = 11.84SRR51 pKa = 11.84AGDD54 pKa = 3.26DD55 pKa = 3.18RR56 pKa = 11.84RR57 pKa = 11.84NGGGANNNAFRR68 pKa = 11.84THH70 pKa = 6.61NNTLNKK76 pKa = 9.79GPRR79 pKa = 11.84GLRR82 pKa = 11.84QRR84 pKa = 11.84QYY86 pKa = 8.79QHH88 pKa = 6.27CQNIQEE94 pKa = 4.47INDD97 pKa = 3.57LSGINSGKK105 pKa = 10.27KK106 pKa = 9.65SRR108 pKa = 3.99
MM1 pKa = 6.78VTDD4 pKa = 4.1NPCFRR9 pKa = 11.84SAVVKK14 pKa = 8.96TYY16 pKa = 10.72RR17 pKa = 11.84SDD19 pKa = 3.3RR20 pKa = 11.84TGGIHH25 pKa = 6.16VPGSNRR31 pKa = 11.84EE32 pKa = 3.89FEE34 pKa = 4.33QEE36 pKa = 3.66VEE38 pKa = 4.08YY39 pKa = 10.83AIASTRR45 pKa = 11.84FSSRR49 pKa = 11.84SRR51 pKa = 11.84AGDD54 pKa = 3.26DD55 pKa = 3.18RR56 pKa = 11.84RR57 pKa = 11.84NGGGANNNAFRR68 pKa = 11.84THH70 pKa = 6.61NNTLNKK76 pKa = 9.79GPRR79 pKa = 11.84GLRR82 pKa = 11.84QRR84 pKa = 11.84QYY86 pKa = 8.79QHH88 pKa = 6.27CQNIQEE94 pKa = 4.47INDD97 pKa = 3.57LSGINSGKK105 pKa = 10.27KK106 pKa = 9.65SRR108 pKa = 3.99
Molecular weight: 12.13 kDa
Isoelectric point according different methods:
Peptides (in silico digests for buttom-up proteomics)
Below you can find in silico digests of the whole proteome with Trypsin, Chymotrypsin, Trypsin+LysC, LysN, ArgC proteases suitable for different mass spec machines.| Try ESI |
 |
|---|
| ChTry ESI |
 |
|---|
| ArgC ESI |
 |
|---|
| LysN ESI |
 |
|---|
| TryLysC ESI |
 |
|---|
| Try MALDI |
 |
|---|
| ChTry MALDI |
 |
|---|
| ArgC MALDI |
 |
|---|
| LysN MALDI |
 |
|---|
| TryLysC MALDI |
 |
|---|
| Try LTQ |
 |
|---|
| ChTry LTQ |
 |
|---|
| ArgC LTQ |
 |
|---|
| LysN LTQ |
 |
|---|
| TryLysC LTQ |
 |
|---|
| Try MSlow |
 |
|---|
| ChTry MSlow |
 |
|---|
| ArgC MSlow |
 |
|---|
| LysN MSlow |
 |
|---|
| TryLysC MSlow |
 |
|---|
| Try MShigh |
 |
|---|
| ChTry MShigh |
 |
|---|
| ArgC MShigh |
 |
|---|
| LysN MShigh |
 |
|---|
| TryLysC MShigh |
 |
|---|
General Statistics
Number of major isoforms |
Number of additional isoforms |
Number of all proteins |
Number of amino acids |
Min. Seq. Length |
Max. Seq. Length |
Avg. Seq. Length |
Avg. Mol. Weight |
|---|---|---|---|---|---|---|---|
6264805 |
41 |
7896 |
481.1 |
53.57 |
Amino acid frequency
Ala |
Cys |
Asp |
Glu |
Phe |
Gly |
His |
Ile |
Lys |
Leu |
|---|---|---|---|---|---|---|---|---|---|
8.02 ± 0.017 | 1.208 ± 0.008 |
5.606 ± 0.015 | 6.199 ± 0.02 |
3.755 ± 0.011 | 6.411 ± 0.02 |
2.428 ± 0.011 | 5.54 ± 0.014 |
4.973 ± 0.018 | 9.092 ± 0.024 |
Met |
Asn |
Gln |
Pro |
Arg |
Ser |
Thr |
Val |
Trp |
Tyr |
|---|---|---|---|---|---|---|---|---|---|
2.102 ± 0.008 | 4.032 ± 0.01 |
5.606 ± 0.018 | 4.159 ± 0.014 |
6.033 ± 0.017 | 8.311 ± 0.025 |
6.127 ± 0.014 | 5.985 ± 0.014 |
1.463 ± 0.008 | 2.949 ± 0.011 |
Most of the basic statistics you can see at this page can be downloaded from this CSV file
Proteome-pI is available under Creative Commons Attribution-NoDerivs license, for more details see here
| Reference: Kozlowski LP. Proteome-pI 2.0: Proteome Isoelectric Point Database Update. Nucleic Acids Res. 2021, doi: 10.1093/nar/gkab944 | Contact: Lukasz P. Kozlowski |
