Blueberry virus A
Taxonomy: Viruses; Riboviria; Orthornavirae; Kitrinoviricota; Alsuviricetes; Martellivirales; Closteroviridae
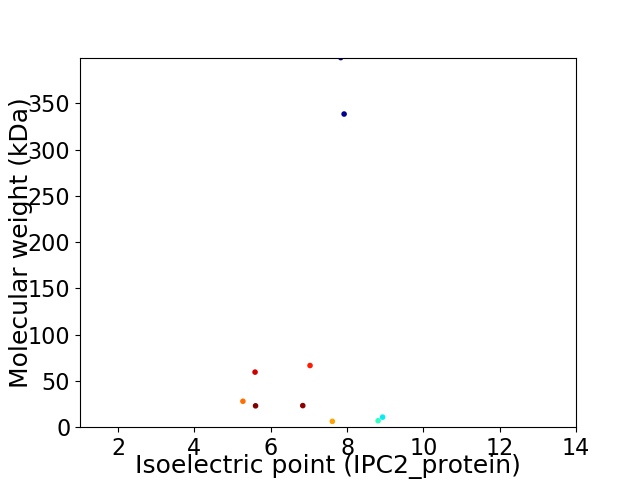
Average proteome isoelectric point is 7.08
Get precalculated fractions of proteins

Virtual 2D-PAGE plot for 10 proteins (isoelectric point calculated using IPC2_protein)
Get csv file with sequences according to given criteria:
* You can choose from 21 different methods for calculating isoelectric point
Summary statistics related to proteome-wise predictions


Protein with the lowest isoelectric point:
>tr|J7MBT3|J7MBT3_9CLOS Coat protein homolog OS=Blueberry virus A OX=1206566 PE=4 SV=1
MM1 pKa = 8.02DD2 pKa = 4.16FMRR5 pKa = 11.84RR6 pKa = 11.84LDD8 pKa = 3.94EE9 pKa = 4.21VHH11 pKa = 7.06CLATPCLHH19 pKa = 6.67LVDD22 pKa = 4.92NISRR26 pKa = 11.84IAYY29 pKa = 9.83SITLPSHH36 pKa = 7.13VYY38 pKa = 7.2QHH40 pKa = 6.62CASQLRR46 pKa = 11.84HH47 pKa = 6.23CLGEE51 pKa = 3.89LDD53 pKa = 5.17FYY55 pKa = 11.39LSPTIFTEE63 pKa = 4.02NPQEE67 pKa = 3.98VAEE70 pKa = 4.48VIVYY74 pKa = 10.25NSEE77 pKa = 3.48VRR79 pKa = 11.84SWINRR84 pKa = 11.84LKK86 pKa = 10.9VEE88 pKa = 4.05YY89 pKa = 10.01EE90 pKa = 3.68RR91 pKa = 11.84LTILSRR97 pKa = 11.84AGSRR101 pKa = 11.84KK102 pKa = 9.52KK103 pKa = 10.83EE104 pKa = 3.52FDD106 pKa = 3.41HH107 pKa = 7.56RR108 pKa = 11.84VGEE111 pKa = 4.23CLKK114 pKa = 10.92LLTAEE119 pKa = 4.79DD120 pKa = 3.6SAAKK124 pKa = 10.05LKK126 pKa = 10.66EE127 pKa = 4.13VIIKK131 pKa = 10.38DD132 pKa = 3.5LEE134 pKa = 4.26GSKK137 pKa = 10.74KK138 pKa = 9.38IDD140 pKa = 3.35PYY142 pKa = 10.66YY143 pKa = 9.87HH144 pKa = 6.19YY145 pKa = 10.16KK146 pKa = 10.64YY147 pKa = 9.91STLEE151 pKa = 3.74PLFEE155 pKa = 4.25EE156 pKa = 4.26MSYY159 pKa = 11.57VSVHH163 pKa = 5.2YY164 pKa = 10.87SEE166 pKa = 5.51VLASRR171 pKa = 11.84LRR173 pKa = 11.84QTASSASKK181 pKa = 11.04SNVEE185 pKa = 4.26EE186 pKa = 4.1VAGDD190 pKa = 3.55ADD192 pKa = 3.76GRR194 pKa = 11.84TQGVEE199 pKa = 3.89QRR201 pKa = 11.84CGDD204 pKa = 3.77DD205 pKa = 3.22VAIGVDD211 pKa = 3.75EE212 pKa = 4.26GHH214 pKa = 6.27SLITGVMSDD223 pKa = 4.36SILPVADD230 pKa = 3.62NYY232 pKa = 11.31AAAKK236 pKa = 8.1EE237 pKa = 3.94NPMYY241 pKa = 10.28NTGKK245 pKa = 9.36EE246 pKa = 3.92WKK248 pKa = 9.95
MM1 pKa = 8.02DD2 pKa = 4.16FMRR5 pKa = 11.84RR6 pKa = 11.84LDD8 pKa = 3.94EE9 pKa = 4.21VHH11 pKa = 7.06CLATPCLHH19 pKa = 6.67LVDD22 pKa = 4.92NISRR26 pKa = 11.84IAYY29 pKa = 9.83SITLPSHH36 pKa = 7.13VYY38 pKa = 7.2QHH40 pKa = 6.62CASQLRR46 pKa = 11.84HH47 pKa = 6.23CLGEE51 pKa = 3.89LDD53 pKa = 5.17FYY55 pKa = 11.39LSPTIFTEE63 pKa = 4.02NPQEE67 pKa = 3.98VAEE70 pKa = 4.48VIVYY74 pKa = 10.25NSEE77 pKa = 3.48VRR79 pKa = 11.84SWINRR84 pKa = 11.84LKK86 pKa = 10.9VEE88 pKa = 4.05YY89 pKa = 10.01EE90 pKa = 3.68RR91 pKa = 11.84LTILSRR97 pKa = 11.84AGSRR101 pKa = 11.84KK102 pKa = 9.52KK103 pKa = 10.83EE104 pKa = 3.52FDD106 pKa = 3.41HH107 pKa = 7.56RR108 pKa = 11.84VGEE111 pKa = 4.23CLKK114 pKa = 10.92LLTAEE119 pKa = 4.79DD120 pKa = 3.6SAAKK124 pKa = 10.05LKK126 pKa = 10.66EE127 pKa = 4.13VIIKK131 pKa = 10.38DD132 pKa = 3.5LEE134 pKa = 4.26GSKK137 pKa = 10.74KK138 pKa = 9.38IDD140 pKa = 3.35PYY142 pKa = 10.66YY143 pKa = 9.87HH144 pKa = 6.19YY145 pKa = 10.16KK146 pKa = 10.64YY147 pKa = 9.91STLEE151 pKa = 3.74PLFEE155 pKa = 4.25EE156 pKa = 4.26MSYY159 pKa = 11.57VSVHH163 pKa = 5.2YY164 pKa = 10.87SEE166 pKa = 5.51VLASRR171 pKa = 11.84LRR173 pKa = 11.84QTASSASKK181 pKa = 11.04SNVEE185 pKa = 4.26EE186 pKa = 4.1VAGDD190 pKa = 3.55ADD192 pKa = 3.76GRR194 pKa = 11.84TQGVEE199 pKa = 3.89QRR201 pKa = 11.84CGDD204 pKa = 3.77DD205 pKa = 3.22VAIGVDD211 pKa = 3.75EE212 pKa = 4.26GHH214 pKa = 6.27SLITGVMSDD223 pKa = 4.36SILPVADD230 pKa = 3.62NYY232 pKa = 11.31AAAKK236 pKa = 8.1EE237 pKa = 3.94NPMYY241 pKa = 10.28NTGKK245 pKa = 9.36EE246 pKa = 3.92WKK248 pKa = 9.95
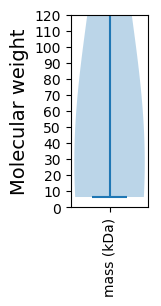
Molecular weight: 28.03 kDa
Isoelectric point according different methods:
Protein with the highest isoelectric point:
>tr|J7MEB7|J7MEB7_9CLOS Leader protease OS=Blueberry virus A OX=1206566 PE=4 SV=1
MM1 pKa = 7.37KK2 pKa = 10.2KK3 pKa = 10.15KK4 pKa = 10.36EE5 pKa = 4.06ITEE8 pKa = 3.99DD9 pKa = 3.39TPLEE13 pKa = 3.99IRR15 pKa = 11.84QKK17 pKa = 9.71LLRR20 pKa = 11.84RR21 pKa = 11.84RR22 pKa = 11.84EE23 pKa = 4.21CNRR26 pKa = 11.84LSSQRR31 pKa = 11.84SRR33 pKa = 11.84DD34 pKa = 3.59NIRR37 pKa = 11.84LKK39 pKa = 10.98KK40 pKa = 10.24EE41 pKa = 3.14IALRR45 pKa = 11.84EE46 pKa = 4.03IEE48 pKa = 4.11NLKK51 pKa = 10.28VLNSSLTVEE60 pKa = 4.64LNEE63 pKa = 4.95LMTNFISINEE73 pKa = 4.03EE74 pKa = 3.54NKK76 pKa = 9.25MLLMQVSYY84 pKa = 10.82LRR86 pKa = 11.84SLLLII91 pKa = 4.42
MM1 pKa = 7.37KK2 pKa = 10.2KK3 pKa = 10.15KK4 pKa = 10.36EE5 pKa = 4.06ITEE8 pKa = 3.99DD9 pKa = 3.39TPLEE13 pKa = 3.99IRR15 pKa = 11.84QKK17 pKa = 9.71LLRR20 pKa = 11.84RR21 pKa = 11.84RR22 pKa = 11.84EE23 pKa = 4.21CNRR26 pKa = 11.84LSSQRR31 pKa = 11.84SRR33 pKa = 11.84DD34 pKa = 3.59NIRR37 pKa = 11.84LKK39 pKa = 10.98KK40 pKa = 10.24EE41 pKa = 3.14IALRR45 pKa = 11.84EE46 pKa = 4.03IEE48 pKa = 4.11NLKK51 pKa = 10.28VLNSSLTVEE60 pKa = 4.64LNEE63 pKa = 4.95LMTNFISINEE73 pKa = 4.03EE74 pKa = 3.54NKK76 pKa = 9.25MLLMQVSYY84 pKa = 10.82LRR86 pKa = 11.84SLLLII91 pKa = 4.42
Molecular weight: 10.89 kDa
Isoelectric point according different methods:
Peptides (in silico digests for buttom-up proteomics)
Below you can find in silico digests of the whole proteome with Trypsin, Chymotrypsin, Trypsin+LysC, LysN, ArgC proteases suitable for different mass spec machines.| Try ESI |
 |
|---|
| ChTry ESI |
 |
|---|
| ArgC ESI |
 |
|---|
| LysN ESI |
 |
|---|
| TryLysC ESI |
 |
|---|
| Try MALDI |
 |
|---|
| ChTry MALDI |
 |
|---|
| ArgC MALDI |
 |
|---|
| LysN MALDI |
 |
|---|
| TryLysC MALDI |
 |
|---|
| Try LTQ |
 |
|---|
| ChTry LTQ |
 |
|---|
| ArgC LTQ |
 |
|---|
| LysN LTQ |
 |
|---|
| TryLysC LTQ |
 |
|---|
| Try MSlow |
 |
|---|
| ChTry MSlow |
 |
|---|
| ArgC MSlow |
 |
|---|
| LysN MSlow |
 |
|---|
| TryLysC MSlow |
 |
|---|
| Try MShigh |
 |
|---|
| ChTry MShigh |
 |
|---|
| ArgC MShigh |
 |
|---|
| LysN MShigh |
 |
|---|
| TryLysC MShigh |
 |
|---|
General Statistics
Number of major isoforms |
Number of additional isoforms |
Number of all proteins |
Number of amino acids |
Min. Seq. Length |
Max. Seq. Length |
Avg. Seq. Length |
Avg. Mol. Weight |
|---|---|---|---|---|---|---|---|
0 |
8619 |
57 |
3576 |
861.9 |
96.26 |
Amino acid frequency
Ala |
Cys |
Asp |
Glu |
Phe |
Gly |
His |
Ile |
Lys |
Leu |
|---|---|---|---|---|---|---|---|---|---|
6.903 ± 0.495 | 2.251 ± 0.195 |
6.033 ± 0.175 | 4.815 ± 0.494 |
4.885 ± 0.283 | 5.79 ± 0.416 |
2.123 ± 0.222 | 5.151 ± 0.138 |
5.441 ± 0.179 | 8.992 ± 0.667 |
Met |
Asn |
Gln |
Pro |
Arg |
Ser |
Thr |
Val |
Trp |
Tyr |
|---|---|---|---|---|---|---|---|---|---|
2.286 ± 0.198 | 4.478 ± 0.297 |
3.817 ± 0.384 | 2.123 ± 0.07 |
6.381 ± 0.342 | 9.99 ± 0.223 |
5.267 ± 0.293 | 8.62 ± 0.338 |
0.963 ± 0.099 | 3.69 ± 0.185 |
Most of the basic statistics you can see at this page can be downloaded from this CSV file
Proteome-pI is available under Creative Commons Attribution-NoDerivs license, for more details see here
| Reference: Kozlowski LP. Proteome-pI 2.0: Proteome Isoelectric Point Database Update. Nucleic Acids Res. 2021, doi: 10.1093/nar/gkab944 | Contact: Lukasz P. Kozlowski |
