Halobonum sp. Gai3-2
Taxonomy: cellular organisms; Archaea; Euryarchaeota; Stenosarchaea group; Halobacteria; Haloferacales; Halorubraceae; Halobaculum
Average proteome isoelectric point is 4.91
Get precalculated fractions of proteins

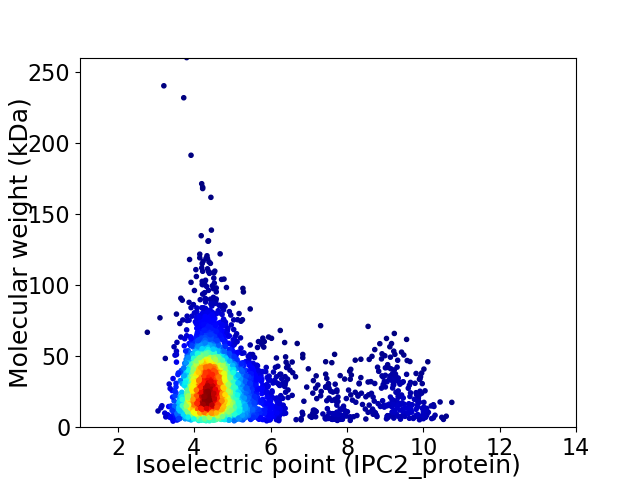
Virtual 2D-PAGE plot for 4176 proteins (isoelectric point calculated using IPC2_protein)
Get csv file with sequences according to given criteria:
* You can choose from 21 different methods for calculating isoelectric point
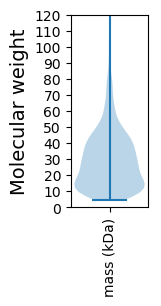
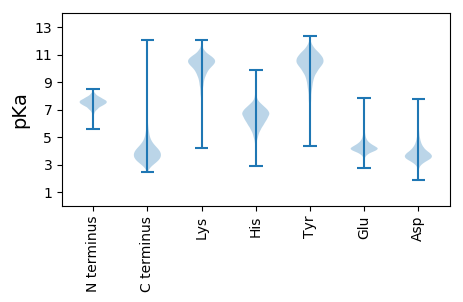
Summary statistics related to proteome-wise predictions


Protein with the lowest isoelectric point:
>tr|A0A7D5GKF7|A0A7D5GKF7_9EURY Uncharacterized protein OS=Halobonum sp. Gai3-2 OX=2743090 GN=HUG10_19290 PE=4 SV=1
MM1 pKa = 7.66TDD3 pKa = 2.9IEE5 pKa = 4.65TTTVCEE11 pKa = 3.83EE12 pKa = 5.05GYY14 pKa = 10.85VCDD17 pKa = 4.3SQMGDD22 pKa = 3.36FNITVDD28 pKa = 3.39ATGDD32 pKa = 3.48EE33 pKa = 4.85GPTANQVLVADD44 pKa = 4.28YY45 pKa = 10.71ASCYY49 pKa = 10.42LPAFRR54 pKa = 11.84AGGQKK59 pKa = 10.21AGHH62 pKa = 7.29DD63 pKa = 4.18DD64 pKa = 3.69LGKK67 pKa = 10.17VQIDD71 pKa = 3.73AEE73 pKa = 4.54ADD75 pKa = 3.5LDD77 pKa = 5.16DD78 pKa = 6.77DD79 pKa = 6.12DD80 pKa = 6.07DD81 pKa = 3.89LTRR84 pKa = 11.84ISFDD88 pKa = 3.75LYY90 pKa = 11.48VEE92 pKa = 4.97ADD94 pKa = 4.09LDD96 pKa = 5.37DD97 pKa = 4.58DD98 pKa = 4.2TLDD101 pKa = 4.02DD102 pKa = 3.99LVARR106 pKa = 11.84GEE108 pKa = 4.67DD109 pKa = 3.08ICHH112 pKa = 4.79VHH114 pKa = 5.58SALRR118 pKa = 11.84EE119 pKa = 4.05GLHH122 pKa = 7.15ADD124 pKa = 3.24ITAHH128 pKa = 7.2ADD130 pKa = 3.13AFF132 pKa = 4.09
MM1 pKa = 7.66TDD3 pKa = 2.9IEE5 pKa = 4.65TTTVCEE11 pKa = 3.83EE12 pKa = 5.05GYY14 pKa = 10.85VCDD17 pKa = 4.3SQMGDD22 pKa = 3.36FNITVDD28 pKa = 3.39ATGDD32 pKa = 3.48EE33 pKa = 4.85GPTANQVLVADD44 pKa = 4.28YY45 pKa = 10.71ASCYY49 pKa = 10.42LPAFRR54 pKa = 11.84AGGQKK59 pKa = 10.21AGHH62 pKa = 7.29DD63 pKa = 4.18DD64 pKa = 3.69LGKK67 pKa = 10.17VQIDD71 pKa = 3.73AEE73 pKa = 4.54ADD75 pKa = 3.5LDD77 pKa = 5.16DD78 pKa = 6.77DD79 pKa = 6.12DD80 pKa = 6.07DD81 pKa = 3.89LTRR84 pKa = 11.84ISFDD88 pKa = 3.75LYY90 pKa = 11.48VEE92 pKa = 4.97ADD94 pKa = 4.09LDD96 pKa = 5.37DD97 pKa = 4.58DD98 pKa = 4.2TLDD101 pKa = 4.02DD102 pKa = 3.99LVARR106 pKa = 11.84GEE108 pKa = 4.67DD109 pKa = 3.08ICHH112 pKa = 4.79VHH114 pKa = 5.58SALRR118 pKa = 11.84EE119 pKa = 4.05GLHH122 pKa = 7.15ADD124 pKa = 3.24ITAHH128 pKa = 7.2ADD130 pKa = 3.13AFF132 pKa = 4.09
Molecular weight: 14.23 kDa
Isoelectric point according different methods:
Protein with the highest isoelectric point:
>tr|A0A7D5KM70|A0A7D5KM70_9EURY Uncharacterized protein OS=Halobonum sp. Gai3-2 OX=2743090 GN=HUG10_07815 PE=4 SV=1
MM1 pKa = 7.04NRR3 pKa = 11.84RR4 pKa = 11.84RR5 pKa = 11.84VGTSVYY11 pKa = 10.86AGFLFLVLGLIAWVSGQPFIFPSLGPSAFILAFEE45 pKa = 4.35RR46 pKa = 11.84RR47 pKa = 11.84GEE49 pKa = 3.93RR50 pKa = 11.84TRR52 pKa = 11.84VYY54 pKa = 10.06RR55 pKa = 11.84IVGSHH60 pKa = 6.35VIGGIAGLLAYY71 pKa = 9.69YY72 pKa = 10.05LIASGVSLTATPAGFSPGGLRR93 pKa = 11.84LAASGFISIVLTSWGMIATDD113 pKa = 3.82TNHH116 pKa = 6.96APACATTLIVSLGLLSTPRR135 pKa = 11.84QVAIIVVSVVILAEE149 pKa = 4.04VHH151 pKa = 5.26WAVLASFKK159 pKa = 10.66KK160 pKa = 10.55AVGGTHH166 pKa = 6.58PRR168 pKa = 11.84IGDD171 pKa = 3.6DD172 pKa = 3.14
MM1 pKa = 7.04NRR3 pKa = 11.84RR4 pKa = 11.84RR5 pKa = 11.84VGTSVYY11 pKa = 10.86AGFLFLVLGLIAWVSGQPFIFPSLGPSAFILAFEE45 pKa = 4.35RR46 pKa = 11.84RR47 pKa = 11.84GEE49 pKa = 3.93RR50 pKa = 11.84TRR52 pKa = 11.84VYY54 pKa = 10.06RR55 pKa = 11.84IVGSHH60 pKa = 6.35VIGGIAGLLAYY71 pKa = 9.69YY72 pKa = 10.05LIASGVSLTATPAGFSPGGLRR93 pKa = 11.84LAASGFISIVLTSWGMIATDD113 pKa = 3.82TNHH116 pKa = 6.96APACATTLIVSLGLLSTPRR135 pKa = 11.84QVAIIVVSVVILAEE149 pKa = 4.04VHH151 pKa = 5.26WAVLASFKK159 pKa = 10.66KK160 pKa = 10.55AVGGTHH166 pKa = 6.58PRR168 pKa = 11.84IGDD171 pKa = 3.6DD172 pKa = 3.14
Molecular weight: 18.05 kDa
Isoelectric point according different methods:
Peptides (in silico digests for buttom-up proteomics)
Below you can find in silico digests of the whole proteome with Trypsin, Chymotrypsin, Trypsin+LysC, LysN, ArgC proteases suitable for different mass spec machines.| Try ESI |
 |
|---|
| ChTry ESI |
 |
|---|
| ArgC ESI |
 |
|---|
| LysN ESI |
 |
|---|
| TryLysC ESI |
 |
|---|
| Try MALDI |
 |
|---|
| ChTry MALDI |
 |
|---|
| ArgC MALDI |
 |
|---|
| LysN MALDI |
 |
|---|
| TryLysC MALDI |
 |
|---|
| Try LTQ |
 |
|---|
| ChTry LTQ |
 |
|---|
| ArgC LTQ |
 |
|---|
| LysN LTQ |
 |
|---|
| TryLysC LTQ |
 |
|---|
| Try MSlow |
 |
|---|
| ChTry MSlow |
 |
|---|
| ArgC MSlow |
 |
|---|
| LysN MSlow |
 |
|---|
| TryLysC MSlow |
 |
|---|
| Try MShigh |
 |
|---|
| ChTry MShigh |
 |
|---|
| ArgC MShigh |
 |
|---|
| LysN MShigh |
 |
|---|
| TryLysC MShigh |
 |
|---|
General Statistics
Number of major isoforms |
Number of additional isoforms |
Number of all proteins |
Number of amino acids |
Min. Seq. Length |
Max. Seq. Length |
Avg. Seq. Length |
Avg. Mol. Weight |
|---|---|---|---|---|---|---|---|
0 |
1181044 |
44 |
2450 |
282.8 |
30.65 |
Amino acid frequency
Ala |
Cys |
Asp |
Glu |
Phe |
Gly |
His |
Ile |
Lys |
Leu |
|---|---|---|---|---|---|---|---|---|---|
11.005 ± 0.056 | 0.7 ± 0.012 |
8.349 ± 0.05 | 8.502 ± 0.058 |
3.396 ± 0.026 | 9.108 ± 0.042 |
2.032 ± 0.021 | 3.539 ± 0.027 |
1.679 ± 0.022 | 8.98 ± 0.046 |
Met |
Asn |
Gln |
Pro |
Arg |
Ser |
Thr |
Val |
Trp |
Tyr |
|---|---|---|---|---|---|---|---|---|---|
1.778 ± 0.019 | 2.315 ± 0.024 |
4.801 ± 0.026 | 2.185 ± 0.023 |
6.786 ± 0.04 | 5.355 ± 0.034 |
6.247 ± 0.037 | 9.406 ± 0.044 |
1.169 ± 0.014 | 2.669 ± 0.02 |
Most of the basic statistics you can see at this page can be downloaded from this CSV file
Proteome-pI is available under Creative Commons Attribution-NoDerivs license, for more details see here
| Reference: Kozlowski LP. Proteome-pI 2.0: Proteome Isoelectric Point Database Update. Nucleic Acids Res. 2021, doi: 10.1093/nar/gkab944 | Contact: Lukasz P. Kozlowski |
