Saccharomyces kudriavzevii (strain ATCC MYA-4449 / AS 2.2408 / CBS 8840 / NBRC 1802 / NCYC 2889) (Yeast)
Taxonomy: cellular organisms; Eukaryota; Opisthokonta; Fungi; Dikarya; Ascomycota; saccharomyceta; Saccharomycotina; Saccharomycetes; Saccharomycetales; Saccharomycetaceae; Saccharomyces; Saccharomyces kudriavzevii
Average proteome isoelectric point is 6.6
Get precalculated fractions of proteins

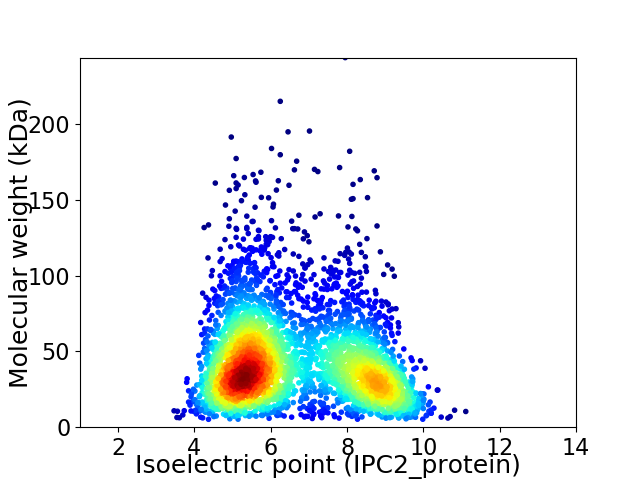
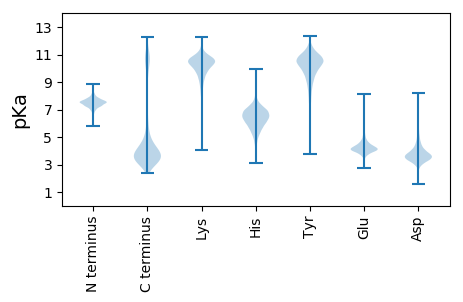
Virtual 2D-PAGE plot for 3745 proteins (isoelectric point calculated using IPC2_protein)
Get csv file with sequences according to given criteria:
* You can choose from 21 different methods for calculating isoelectric point
Summary statistics related to proteome-wise predictions


Protein with the lowest isoelectric point:
>tr|J6EQ84|J6EQ84_SACK1 Histone H2B OS=Saccharomyces kudriavzevii (strain ATCC MYA-4449 / AS 2.2408 / CBS 8840 / NBRC 1802 / NCYC 2889) OX=226230 GN=SKUD_158603 PE=3 SV=1
MM1 pKa = 7.89IITSTLVLTIIWSILPSSSDD21 pKa = 2.92EE22 pKa = 3.97HH23 pKa = 6.43TPQQFISTILDD34 pKa = 3.41IFPQRR39 pKa = 11.84RR40 pKa = 11.84WIITLEE46 pKa = 4.23SIMLMGMLCTYY57 pKa = 9.93TGLLMYY63 pKa = 10.63NEE65 pKa = 5.36DD66 pKa = 4.26SLTPPLDD73 pKa = 3.72SLCTVTDD80 pKa = 3.16AGGQLVIEE88 pKa = 5.54DD89 pKa = 4.11DD90 pKa = 3.61TDD92 pKa = 3.77VLVKK96 pKa = 10.2RR97 pKa = 11.84WAFKK101 pKa = 8.93EE102 pKa = 3.97TSGIYY107 pKa = 9.77DD108 pKa = 4.49LPLMDD113 pKa = 5.31ACQLLYY119 pKa = 10.83LYY121 pKa = 10.83DD122 pKa = 4.28NEE124 pKa = 4.42DD125 pKa = 3.18LSRR128 pKa = 5.19
MM1 pKa = 7.89IITSTLVLTIIWSILPSSSDD21 pKa = 2.92EE22 pKa = 3.97HH23 pKa = 6.43TPQQFISTILDD34 pKa = 3.41IFPQRR39 pKa = 11.84RR40 pKa = 11.84WIITLEE46 pKa = 4.23SIMLMGMLCTYY57 pKa = 9.93TGLLMYY63 pKa = 10.63NEE65 pKa = 5.36DD66 pKa = 4.26SLTPPLDD73 pKa = 3.72SLCTVTDD80 pKa = 3.16AGGQLVIEE88 pKa = 5.54DD89 pKa = 4.11DD90 pKa = 3.61TDD92 pKa = 3.77VLVKK96 pKa = 10.2RR97 pKa = 11.84WAFKK101 pKa = 8.93EE102 pKa = 3.97TSGIYY107 pKa = 9.77DD108 pKa = 4.49LPLMDD113 pKa = 5.31ACQLLYY119 pKa = 10.83LYY121 pKa = 10.83DD122 pKa = 4.28NEE124 pKa = 4.42DD125 pKa = 3.18LSRR128 pKa = 5.19
Molecular weight: 14.56 kDa
Isoelectric point according different methods:
Protein with the highest isoelectric point:
>tr|J4TT88|J4TT88_SACK1 Nucleolar complex-associated protein 3 OS=Saccharomyces kudriavzevii (strain ATCC MYA-4449 / AS 2.2408 / CBS 8840 / NBRC 1802 / NCYC 2889) OX=226230 GN=YLR002C PE=3 SV=1
MM1 pKa = 7.52LSSISSFSALSVLRR15 pKa = 11.84PQSSMLLNSPPMKK28 pKa = 10.19TMSLTALGFGFIGQRR43 pKa = 11.84RR44 pKa = 11.84WKK46 pKa = 10.67SRR48 pKa = 11.84GNTYY52 pKa = 10.31QPSTLKK58 pKa = 10.47RR59 pKa = 11.84KK60 pKa = 8.63RR61 pKa = 11.84TFGFLARR68 pKa = 11.84AKK70 pKa = 9.98SKK72 pKa = 10.64QGSKK76 pKa = 9.52ILKK79 pKa = 8.89RR80 pKa = 11.84RR81 pKa = 11.84KK82 pKa = 9.76LKK84 pKa = 10.58GRR86 pKa = 11.84WFLSHH91 pKa = 7.05
MM1 pKa = 7.52LSSISSFSALSVLRR15 pKa = 11.84PQSSMLLNSPPMKK28 pKa = 10.19TMSLTALGFGFIGQRR43 pKa = 11.84RR44 pKa = 11.84WKK46 pKa = 10.67SRR48 pKa = 11.84GNTYY52 pKa = 10.31QPSTLKK58 pKa = 10.47RR59 pKa = 11.84KK60 pKa = 8.63RR61 pKa = 11.84TFGFLARR68 pKa = 11.84AKK70 pKa = 9.98SKK72 pKa = 10.64QGSKK76 pKa = 9.52ILKK79 pKa = 8.89RR80 pKa = 11.84RR81 pKa = 11.84KK82 pKa = 9.76LKK84 pKa = 10.58GRR86 pKa = 11.84WFLSHH91 pKa = 7.05
Molecular weight: 10.36 kDa
Isoelectric point according different methods:
Peptides (in silico digests for buttom-up proteomics)
Below you can find in silico digests of the whole proteome with Trypsin, Chymotrypsin, Trypsin+LysC, LysN, ArgC proteases suitable for different mass spec machines.| Try ESI |
 |
|---|
| ChTry ESI |
 |
|---|
| ArgC ESI |
 |
|---|
| LysN ESI |
 |
|---|
| TryLysC ESI |
 |
|---|
| Try MALDI |
 |
|---|
| ChTry MALDI |
 |
|---|
| ArgC MALDI |
 |
|---|
| LysN MALDI |
 |
|---|
| TryLysC MALDI |
 |
|---|
| Try LTQ |
 |
|---|
| ChTry LTQ |
 |
|---|
| ArgC LTQ |
 |
|---|
| LysN LTQ |
 |
|---|
| TryLysC LTQ |
 |
|---|
| Try MSlow |
 |
|---|
| ChTry MSlow |
 |
|---|
| ArgC MSlow |
 |
|---|
| LysN MSlow |
 |
|---|
| TryLysC MSlow |
 |
|---|
| Try MShigh |
 |
|---|
| ChTry MShigh |
 |
|---|
| ArgC MShigh |
 |
|---|
| LysN MShigh |
 |
|---|
| TryLysC MShigh |
 |
|---|
General Statistics
Number of major isoforms |
Number of additional isoforms |
Number of all proteins |
Number of amino acids |
Min. Seq. Length |
Max. Seq. Length |
Avg. Seq. Length |
Avg. Mol. Weight |
|---|---|---|---|---|---|---|---|
0 |
1538632 |
45 |
2159 |
410.8 |
46.43 |
Amino acid frequency
Ala |
Cys |
Asp |
Glu |
Phe |
Gly |
His |
Ile |
Lys |
Leu |
|---|---|---|---|---|---|---|---|---|---|
5.651 ± 0.04 | 1.31 ± 0.015 |
5.913 ± 0.029 | 6.561 ± 0.039 |
4.447 ± 0.027 | 5.196 ± 0.039 |
2.181 ± 0.016 | 6.417 ± 0.03 |
7.273 ± 0.039 | 9.525 ± 0.043 |
Met |
Asn |
Gln |
Pro |
Arg |
Ser |
Thr |
Val |
Trp |
Tyr |
|---|---|---|---|---|---|---|---|---|---|
2.084 ± 0.013 | 5.975 ± 0.039 |
4.342 ± 0.026 | 3.969 ± 0.032 |
4.566 ± 0.03 | 8.856 ± 0.055 |
5.703 ± 0.034 | 5.65 ± 0.026 |
1.043 ± 0.013 | 3.336 ± 0.018 |
Most of the basic statistics you can see at this page can be downloaded from this CSV file
Proteome-pI is available under Creative Commons Attribution-NoDerivs license, for more details see here
| Reference: Kozlowski LP. Proteome-pI 2.0: Proteome Isoelectric Point Database Update. Nucleic Acids Res. 2021, doi: 10.1093/nar/gkab944 | Contact: Lukasz P. Kozlowski |
