Pseudomonas nosocomialis
Taxonomy: cellular organisms; Bacteria; Proteobacteria; Gammaproteobacteria; Pseudomonadales; Pseudomonadaceae; Pseudomonas
Average proteome isoelectric point is 6.32
Get precalculated fractions of proteins
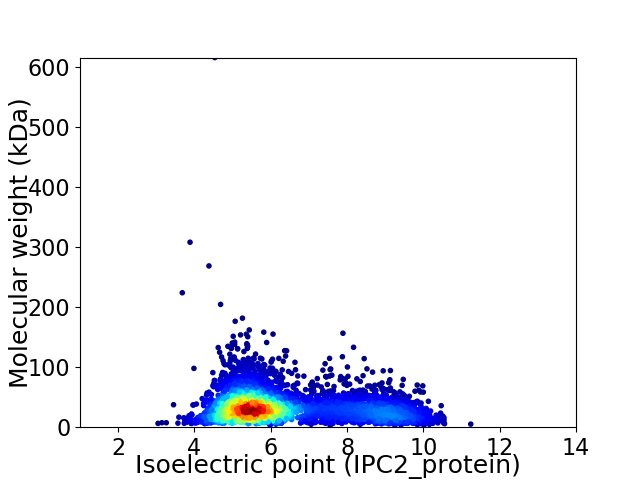
Virtual 2D-PAGE plot for 4317 proteins (isoelectric point calculated using IPC2_protein)
Get csv file with sequences according to given criteria:
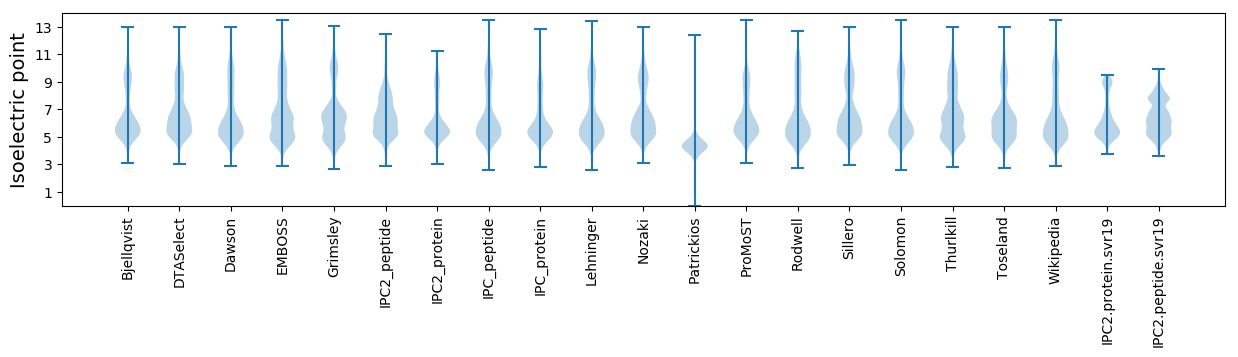
* You can choose from 21 different methods for calculating isoelectric point
Summary statistics related to proteome-wise predictions
Protein with the lowest isoelectric point:
>tr|A0A5R9QGF8|A0A5R9QGF8_9PSED Malate synthase G OS=Pseudomonas nosocomialis OX=1056496 GN=glcB PE=3 SV=1
MM1 pKa = 7.56KK2 pKa = 10.16KK3 pKa = 8.28WQCVVCGLIYY13 pKa = 10.7DD14 pKa = 4.53EE15 pKa = 4.7ALGWPDD21 pKa = 5.12DD22 pKa = 4.61GIAPGTRR29 pKa = 11.84WEE31 pKa = 4.77DD32 pKa = 3.61VPADD36 pKa = 4.15WLCPDD41 pKa = 4.43CGVGKK46 pKa = 10.49LDD48 pKa = 3.92FEE50 pKa = 4.86MIEE53 pKa = 4.05ISS55 pKa = 3.39
MM1 pKa = 7.56KK2 pKa = 10.16KK3 pKa = 8.28WQCVVCGLIYY13 pKa = 10.7DD14 pKa = 4.53EE15 pKa = 4.7ALGWPDD21 pKa = 5.12DD22 pKa = 4.61GIAPGTRR29 pKa = 11.84WEE31 pKa = 4.77DD32 pKa = 3.61VPADD36 pKa = 4.15WLCPDD41 pKa = 4.43CGVGKK46 pKa = 10.49LDD48 pKa = 3.92FEE50 pKa = 4.86MIEE53 pKa = 4.05ISS55 pKa = 3.39
Molecular weight: 6.17 kDa
Isoelectric point according different methods:
Protein with the highest isoelectric point:
>tr|A0A5R9Q9E1|A0A5R9Q9E1_9PSED MotA/TolQ/ExbB proton channel family protein OS=Pseudomonas nosocomialis OX=1056496 GN=DN820_19800 PE=3 SV=1
MM1 pKa = 7.45KK2 pKa = 9.56RR3 pKa = 11.84TFQPSTIKK11 pKa = 10.52RR12 pKa = 11.84ARR14 pKa = 11.84THH16 pKa = 5.94GFRR19 pKa = 11.84ARR21 pKa = 11.84MATKK25 pKa = 10.16NGRR28 pKa = 11.84AVLSRR33 pKa = 11.84RR34 pKa = 11.84RR35 pKa = 11.84AKK37 pKa = 9.83GRR39 pKa = 11.84KK40 pKa = 8.88RR41 pKa = 11.84LTVV44 pKa = 3.11
MM1 pKa = 7.45KK2 pKa = 9.56RR3 pKa = 11.84TFQPSTIKK11 pKa = 10.52RR12 pKa = 11.84ARR14 pKa = 11.84THH16 pKa = 5.94GFRR19 pKa = 11.84ARR21 pKa = 11.84MATKK25 pKa = 10.16NGRR28 pKa = 11.84AVLSRR33 pKa = 11.84RR34 pKa = 11.84RR35 pKa = 11.84AKK37 pKa = 9.83GRR39 pKa = 11.84KK40 pKa = 8.88RR41 pKa = 11.84LTVV44 pKa = 3.11
Molecular weight: 5.15 kDa
Isoelectric point according different methods:
Peptides (in silico digests for buttom-up proteomics)
Below you can find in silico digests of the whole proteome with Trypsin, Chymotrypsin, Trypsin+LysC, LysN, ArgC proteases suitable for different mass spec machines.| Try ESI |
 |
|---|
| ChTry ESI |
|
|---|
| ArgC ESI |
|
|---|
| LysN ESI |
|
|---|
| TryLysC ESI |
|
|---|
| Try MALDI |
|
|---|
| ChTry MALDI |
|
|---|
| ArgC MALDI |
|
|---|
| LysN MALDI |
|
|---|
| TryLysC MALDI |
|
|---|
| Try LTQ |
|
|---|
| ChTry LTQ |
|
|---|
| ArgC LTQ |
|
|---|
| LysN LTQ |
|
|---|
| TryLysC LTQ |
|
|---|
| Try MSlow |
|
|---|
| ChTry MSlow |
|
|---|
| ArgC MSlow |
|
|---|
| LysN MSlow |
|
|---|
| TryLysC MSlow |
|
|---|
| Try MShigh |
|
|---|
| ChTry MShigh |
|
|---|
| ArgC MShigh |
|
|---|
| LysN MShigh |
|
|---|
| TryLysC MShigh |
|
|---|
General Statistics
Number of major isoforms |
Number of additional isoforms |
Number of all proteins |
Number of amino acids |
Min. Seq. Length |
Max. Seq. Length |
Avg. Seq. Length |
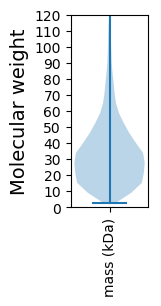
Avg. Mol. Weight |
|---|---|---|---|---|---|---|---|
0 |
1397476 |
26 |
6106 |
323.7 |
35.49 |
Amino acid frequency
Ala |
Cys |
Asp |
Glu |
Phe |
Gly |
His |
Ile |
Lys |
Leu |
|---|---|---|---|---|---|---|---|---|---|
11.387 ± 0.049 | 0.974 ± 0.014 |
5.436 ± 0.032 | 6.102 ± 0.034 |
3.544 ± 0.026 | 8.218 ± 0.041 |
2.227 ± 0.02 | 4.604 ± 0.027 |
2.922 ± 0.033 | 11.89 ± 0.059 |
Met |
Asn |
Gln |
Pro |
Arg |
Ser |
Thr |
Val |
Trp |
Tyr |
|---|---|---|---|---|---|---|---|---|---|
2.3 ± 0.02 | 2.683 ± 0.022 |
5.002 ± 0.03 | 4.355 ± 0.029 |
7.241 ± 0.039 | 5.457 ± 0.032 |
4.7 ± 0.028 | 7.111 ± 0.036 |
1.41 ± 0.017 | 2.436 ± 0.021 |
Most of the basic statistics you can see at this page can be downloaded from this CSV file
See this proteome in:

Proteome-pI is available under Creative Commons Attribution-NoDerivs license, for more details see here
| Reference: Kozlowski LP. Proteome-pI 2.0: Proteome Isoelectric Point Database Update. Nucleic Acids Res. 2021, doi: 10.1093/nar/gkab944 | Contact: Lukasz P. Kozlowski |