Trichococcus palustris
Taxonomy: cellular organisms; Bacteria; Terrabacteria group; Firmicutes; Bacilli; Lactobacillales; Carnobacteriaceae; Trichococcus
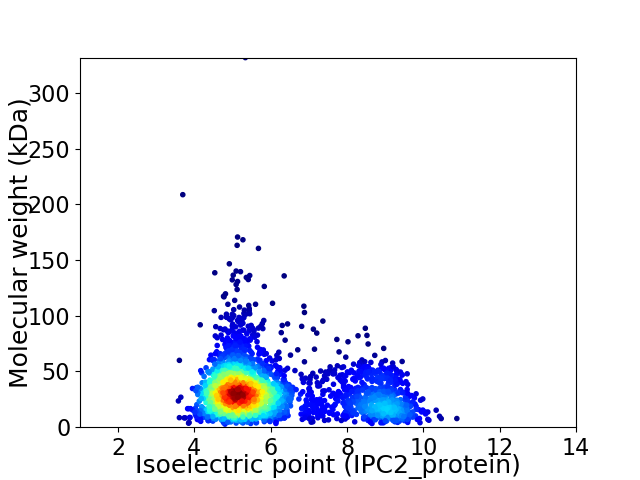
Average proteome isoelectric point is 6.07
Get precalculated fractions of proteins

Virtual 2D-PAGE plot for 2699 proteins (isoelectric point calculated using IPC2_protein)
Get csv file with sequences according to given criteria:
* You can choose from 21 different methods for calculating isoelectric point
Summary statistics related to proteome-wise predictions


Protein with the lowest isoelectric point:
>tr|A0A143YA43|A0A143YA43_9LACT ATP-dependent helicase/nuclease subunit A OS=Trichococcus palustris OX=140314 GN=addA PE=3 SV=1
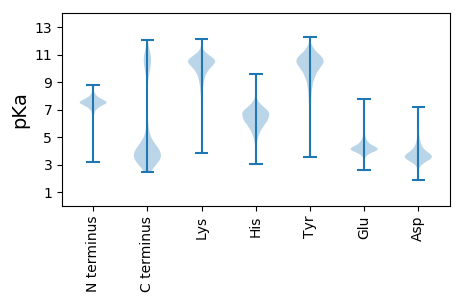
MM1 pKa = 8.1IYY3 pKa = 10.46EE4 pKa = 4.42FRR6 pKa = 11.84LSLRR10 pKa = 11.84DD11 pKa = 2.87IGIPVWRR18 pKa = 11.84DD19 pKa = 3.06IQVDD23 pKa = 4.08CTDD26 pKa = 3.9SFHH29 pKa = 7.93DD30 pKa = 3.99FNTYY34 pKa = 9.1IQALFDD40 pKa = 3.35WSSIFEE46 pKa = 4.05HH47 pKa = 6.71RR48 pKa = 11.84FEE50 pKa = 4.08ITRR53 pKa = 11.84SGGVEE58 pKa = 3.88IPPVIIEE65 pKa = 4.12EE66 pKa = 4.31TSMDD70 pKa = 3.61EE71 pKa = 4.63YY72 pKa = 11.17EE73 pKa = 4.77ALDD76 pKa = 3.89EE77 pKa = 4.92EE78 pKa = 5.77GDD80 pKa = 3.73FADD83 pKa = 5.45AFSEE87 pKa = 4.71DD88 pKa = 4.12SFDD91 pKa = 3.88EE92 pKa = 4.56NYY94 pKa = 10.71EE95 pKa = 3.91LDD97 pKa = 3.71YY98 pKa = 11.82EE99 pKa = 4.37EE100 pKa = 6.18AFDD103 pKa = 3.92EE104 pKa = 5.16DD105 pKa = 4.57EE106 pKa = 4.02YY107 pKa = 11.64RR108 pKa = 11.84PIGSYY113 pKa = 10.36FVDD116 pKa = 3.48VGDD119 pKa = 3.77QATYY123 pKa = 9.54TYY125 pKa = 9.39FTDD128 pKa = 3.49AVLEE132 pKa = 4.01IEE134 pKa = 5.04IILTEE139 pKa = 4.01IVAAQEE145 pKa = 3.87DD146 pKa = 4.25ATYY149 pKa = 9.75PLCTGAEE156 pKa = 3.94NLAPEE161 pKa = 4.38EE162 pKa = 3.88MDD164 pKa = 3.91DD165 pKa = 5.81RR166 pKa = 11.84GDD168 pKa = 3.68ILQKK172 pKa = 9.82KK173 pKa = 9.57AKK175 pKa = 9.52LISVKK180 pKa = 10.55KK181 pKa = 9.23EE182 pKa = 3.61EE183 pKa = 4.47LVAAINKK190 pKa = 8.6EE191 pKa = 3.82LALLGDD197 pKa = 5.03AISYY201 pKa = 9.96DD202 pKa = 3.45SEE204 pKa = 4.6YY205 pKa = 11.3EE206 pKa = 4.07EE207 pKa = 4.64FQHH210 pKa = 7.19DD211 pKa = 3.86LHH213 pKa = 8.31FDD215 pKa = 3.48DD216 pKa = 6.44DD217 pKa = 4.74EE218 pKa = 6.6IYY220 pKa = 10.83DD221 pKa = 3.9EE222 pKa = 5.34PYY224 pKa = 10.68DD225 pKa = 4.29AEE227 pKa = 4.87SDD229 pKa = 3.97NSDD232 pKa = 3.55CC233 pKa = 5.85
MM1 pKa = 8.1IYY3 pKa = 10.46EE4 pKa = 4.42FRR6 pKa = 11.84LSLRR10 pKa = 11.84DD11 pKa = 2.87IGIPVWRR18 pKa = 11.84DD19 pKa = 3.06IQVDD23 pKa = 4.08CTDD26 pKa = 3.9SFHH29 pKa = 7.93DD30 pKa = 3.99FNTYY34 pKa = 9.1IQALFDD40 pKa = 3.35WSSIFEE46 pKa = 4.05HH47 pKa = 6.71RR48 pKa = 11.84FEE50 pKa = 4.08ITRR53 pKa = 11.84SGGVEE58 pKa = 3.88IPPVIIEE65 pKa = 4.12EE66 pKa = 4.31TSMDD70 pKa = 3.61EE71 pKa = 4.63YY72 pKa = 11.17EE73 pKa = 4.77ALDD76 pKa = 3.89EE77 pKa = 4.92EE78 pKa = 5.77GDD80 pKa = 3.73FADD83 pKa = 5.45AFSEE87 pKa = 4.71DD88 pKa = 4.12SFDD91 pKa = 3.88EE92 pKa = 4.56NYY94 pKa = 10.71EE95 pKa = 3.91LDD97 pKa = 3.71YY98 pKa = 11.82EE99 pKa = 4.37EE100 pKa = 6.18AFDD103 pKa = 3.92EE104 pKa = 5.16DD105 pKa = 4.57EE106 pKa = 4.02YY107 pKa = 11.64RR108 pKa = 11.84PIGSYY113 pKa = 10.36FVDD116 pKa = 3.48VGDD119 pKa = 3.77QATYY123 pKa = 9.54TYY125 pKa = 9.39FTDD128 pKa = 3.49AVLEE132 pKa = 4.01IEE134 pKa = 5.04IILTEE139 pKa = 4.01IVAAQEE145 pKa = 3.87DD146 pKa = 4.25ATYY149 pKa = 9.75PLCTGAEE156 pKa = 3.94NLAPEE161 pKa = 4.38EE162 pKa = 3.88MDD164 pKa = 3.91DD165 pKa = 5.81RR166 pKa = 11.84GDD168 pKa = 3.68ILQKK172 pKa = 9.82KK173 pKa = 9.57AKK175 pKa = 9.52LISVKK180 pKa = 10.55KK181 pKa = 9.23EE182 pKa = 3.61EE183 pKa = 4.47LVAAINKK190 pKa = 8.6EE191 pKa = 3.82LALLGDD197 pKa = 5.03AISYY201 pKa = 9.96DD202 pKa = 3.45SEE204 pKa = 4.6YY205 pKa = 11.3EE206 pKa = 4.07EE207 pKa = 4.64FQHH210 pKa = 7.19DD211 pKa = 3.86LHH213 pKa = 8.31FDD215 pKa = 3.48DD216 pKa = 6.44DD217 pKa = 4.74EE218 pKa = 6.6IYY220 pKa = 10.83DD221 pKa = 3.9EE222 pKa = 5.34PYY224 pKa = 10.68DD225 pKa = 4.29AEE227 pKa = 4.87SDD229 pKa = 3.97NSDD232 pKa = 3.55CC233 pKa = 5.85
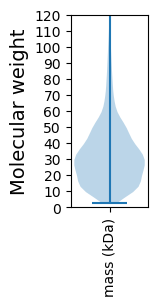
Molecular weight: 26.9 kDa
Isoelectric point according different methods:
Protein with the highest isoelectric point:
>tr|A0A143YKT4|A0A143YKT4_9LACT Phosphate-specific transport system accessory protein PhoU OS=Trichococcus palustris OX=140314 GN=Tpal_1395 PE=3 SV=1
MM1 pKa = 7.92PKK3 pKa = 10.12QKK5 pKa = 7.54THH7 pKa = 6.73RR8 pKa = 11.84GSAKK12 pKa = 9.69RR13 pKa = 11.84FKK15 pKa = 10.09RR16 pKa = 11.84TGNGGLKK23 pKa = 9.55RR24 pKa = 11.84WSAFTSHH31 pKa = 6.95RR32 pKa = 11.84FHH34 pKa = 7.48GKK36 pKa = 6.37TKK38 pKa = 9.57KK39 pKa = 9.4QRR41 pKa = 11.84RR42 pKa = 11.84QLRR45 pKa = 11.84QASMVSPSDD54 pKa = 3.3MKK56 pKa = 10.83RR57 pKa = 11.84ISQQLSQMRR66 pKa = 3.6
MM1 pKa = 7.92PKK3 pKa = 10.12QKK5 pKa = 7.54THH7 pKa = 6.73RR8 pKa = 11.84GSAKK12 pKa = 9.69RR13 pKa = 11.84FKK15 pKa = 10.09RR16 pKa = 11.84TGNGGLKK23 pKa = 9.55RR24 pKa = 11.84WSAFTSHH31 pKa = 6.95RR32 pKa = 11.84FHH34 pKa = 7.48GKK36 pKa = 6.37TKK38 pKa = 9.57KK39 pKa = 9.4QRR41 pKa = 11.84RR42 pKa = 11.84QLRR45 pKa = 11.84QASMVSPSDD54 pKa = 3.3MKK56 pKa = 10.83RR57 pKa = 11.84ISQQLSQMRR66 pKa = 3.6
Molecular weight: 7.77 kDa
Isoelectric point according different methods:
Peptides (in silico digests for buttom-up proteomics)
Below you can find in silico digests of the whole proteome with Trypsin, Chymotrypsin, Trypsin+LysC, LysN, ArgC proteases suitable for different mass spec machines.| Try ESI |
 |
|---|
| ChTry ESI |
 |
|---|
| ArgC ESI |
 |
|---|
| LysN ESI |
 |
|---|
| TryLysC ESI |
 |
|---|
| Try MALDI |
 |
|---|
| ChTry MALDI |
 |
|---|
| ArgC MALDI |
 |
|---|
| LysN MALDI |
 |
|---|
| TryLysC MALDI |
 |
|---|
| Try LTQ |
 |
|---|
| ChTry LTQ |
 |
|---|
| ArgC LTQ |
 |
|---|
| LysN LTQ |
 |
|---|
| TryLysC LTQ |
 |
|---|
| Try MSlow |
 |
|---|
| ChTry MSlow |
 |
|---|
| ArgC MSlow |
 |
|---|
| LysN MSlow |
 |
|---|
| TryLysC MSlow |
 |
|---|
| Try MShigh |
 |
|---|
| ChTry MShigh |
 |
|---|
| ArgC MShigh |
 |
|---|
| LysN MShigh |
 |
|---|
| TryLysC MShigh |
 |
|---|
General Statistics
Number of major isoforms |
Number of additional isoforms |
Number of all proteins |
Number of amino acids |
Min. Seq. Length |
Max. Seq. Length |
Avg. Seq. Length |
Avg. Mol. Weight |
|---|---|---|---|---|---|---|---|
0 |
820627 |
26 |
2918 |
304.0 |
33.91 |
Amino acid frequency
Ala |
Cys |
Asp |
Glu |
Phe |
Gly |
His |
Ile |
Lys |
Leu |
|---|---|---|---|---|---|---|---|---|---|
8.128 ± 0.051 | 0.718 ± 0.013 |
5.504 ± 0.034 | 7.185 ± 0.051 |
4.45 ± 0.036 | 7.011 ± 0.043 |
1.871 ± 0.02 | 7.6 ± 0.044 |
6.592 ± 0.035 | 9.542 ± 0.046 |
Met |
Asn |
Gln |
Pro |
Arg |
Ser |
Thr |
Val |
Trp |
Tyr |
|---|---|---|---|---|---|---|---|---|---|
2.866 ± 0.022 | 4.415 ± 0.034 |
3.509 ± 0.026 | 3.568 ± 0.032 |
3.99 ± 0.034 | 5.837 ± 0.038 |
5.69 ± 0.037 | 6.98 ± 0.036 |
0.87 ± 0.015 | 3.668 ± 0.031 |
Most of the basic statistics you can see at this page can be downloaded from this CSV file
Proteome-pI is available under Creative Commons Attribution-NoDerivs license, for more details see here
| Reference: Kozlowski LP. Proteome-pI 2.0: Proteome Isoelectric Point Database Update. Nucleic Acids Res. 2021, doi: 10.1093/nar/gkab944 | Contact: Lukasz P. Kozlowski |
