Gallaecimonas xiamenensis 3-C-1
Taxonomy: cellular organisms; Bacteria; Proteobacteria; Gammaproteobacteria; Gammaproteobacteria incertae sedis; Gallaecimonas; Gallaecimonas xiamenensis
Average proteome isoelectric point is 6.33
Get precalculated fractions of proteins

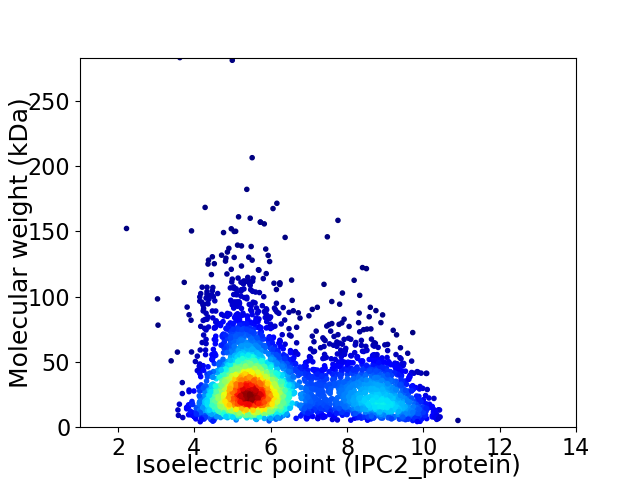
Virtual 2D-PAGE plot for 3798 proteins (isoelectric point calculated using IPC2_protein)
Get csv file with sequences according to given criteria:
* You can choose from 21 different methods for calculating isoelectric point
Summary statistics related to proteome-wise predictions


Protein with the lowest isoelectric point:
>tr|K2JXC7|K2JXC7_9GAMM M20_dimer domain-containing protein OS=Gallaecimonas xiamenensis 3-C-1 OX=745411 GN=B3C1_14545 PE=4 SV=1
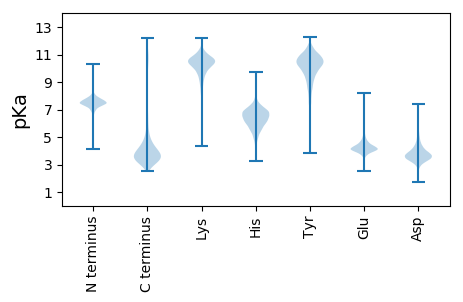
MM1 pKa = 7.65KK2 pKa = 9.11KK3 pKa = 8.29TLTLALTSAAALVLTACGGSSGGDD27 pKa = 3.37DD28 pKa = 3.53TPSPQTARR36 pKa = 11.84LSISIGDD43 pKa = 4.13APVDD47 pKa = 3.37TADD50 pKa = 3.59QVVVTIDD57 pKa = 3.53NIVLKK62 pKa = 10.82RR63 pKa = 11.84EE64 pKa = 4.13GEE66 pKa = 4.04EE67 pKa = 4.41DD68 pKa = 3.5VVLPVRR74 pKa = 11.84DD75 pKa = 4.13ADD77 pKa = 4.0NQPVTLDD84 pKa = 3.53LLDD87 pKa = 3.9YY88 pKa = 11.0QGGDD92 pKa = 3.06VFVALNGVTIPAGTYY107 pKa = 9.75SDD109 pKa = 3.73VRR111 pKa = 11.84LDD113 pKa = 4.49ILDD116 pKa = 4.15EE117 pKa = 4.37DD118 pKa = 4.43TANSYY123 pKa = 10.94VDD125 pKa = 3.51ADD127 pKa = 4.0GGIHH131 pKa = 5.65EE132 pKa = 5.45LKK134 pKa = 10.88VPSDD138 pKa = 3.65EE139 pKa = 4.63LKK141 pKa = 11.19LGGFDD146 pKa = 3.74AAAGGQLAFTIDD158 pKa = 3.49FNLRR162 pKa = 11.84KK163 pKa = 10.18AMTYY167 pKa = 10.53NPGPDD172 pKa = 3.13RR173 pKa = 11.84YY174 pKa = 9.46ILKK177 pKa = 10.03PRR179 pKa = 11.84GIQLLEE185 pKa = 3.85TAILGQIGGEE195 pKa = 3.94VDD197 pKa = 3.08PALAEE202 pKa = 4.22SCNTGTDD209 pKa = 3.16NVNYY213 pKa = 10.0GFVYY217 pKa = 10.21LYY219 pKa = 10.47SGHH222 pKa = 7.54DD223 pKa = 3.89LTTLADD229 pKa = 3.82DD230 pKa = 4.81HH231 pKa = 7.06DD232 pKa = 4.33QGAAGAPEE240 pKa = 4.56GASIPVASMAVTLSDD255 pKa = 4.27DD256 pKa = 4.26ADD258 pKa = 4.02PATTDD263 pKa = 3.05PYY265 pKa = 10.25TYY267 pKa = 10.95KK268 pKa = 10.66FGLLMPGDD276 pKa = 3.7YY277 pKa = 10.17TLAFSCDD284 pKa = 3.95GINDD288 pKa = 3.78LPEE291 pKa = 5.38SYY293 pKa = 10.5EE294 pKa = 3.9GLTIPNPEE302 pKa = 4.0GLSYY306 pKa = 11.0EE307 pKa = 4.22LTLTDD312 pKa = 5.74GGDD315 pKa = 3.4LTQDD319 pKa = 3.13INSLSTGLL327 pKa = 3.8
MM1 pKa = 7.65KK2 pKa = 9.11KK3 pKa = 8.29TLTLALTSAAALVLTACGGSSGGDD27 pKa = 3.37DD28 pKa = 3.53TPSPQTARR36 pKa = 11.84LSISIGDD43 pKa = 4.13APVDD47 pKa = 3.37TADD50 pKa = 3.59QVVVTIDD57 pKa = 3.53NIVLKK62 pKa = 10.82RR63 pKa = 11.84EE64 pKa = 4.13GEE66 pKa = 4.04EE67 pKa = 4.41DD68 pKa = 3.5VVLPVRR74 pKa = 11.84DD75 pKa = 4.13ADD77 pKa = 4.0NQPVTLDD84 pKa = 3.53LLDD87 pKa = 3.9YY88 pKa = 11.0QGGDD92 pKa = 3.06VFVALNGVTIPAGTYY107 pKa = 9.75SDD109 pKa = 3.73VRR111 pKa = 11.84LDD113 pKa = 4.49ILDD116 pKa = 4.15EE117 pKa = 4.37DD118 pKa = 4.43TANSYY123 pKa = 10.94VDD125 pKa = 3.51ADD127 pKa = 4.0GGIHH131 pKa = 5.65EE132 pKa = 5.45LKK134 pKa = 10.88VPSDD138 pKa = 3.65EE139 pKa = 4.63LKK141 pKa = 11.19LGGFDD146 pKa = 3.74AAAGGQLAFTIDD158 pKa = 3.49FNLRR162 pKa = 11.84KK163 pKa = 10.18AMTYY167 pKa = 10.53NPGPDD172 pKa = 3.13RR173 pKa = 11.84YY174 pKa = 9.46ILKK177 pKa = 10.03PRR179 pKa = 11.84GIQLLEE185 pKa = 3.85TAILGQIGGEE195 pKa = 3.94VDD197 pKa = 3.08PALAEE202 pKa = 4.22SCNTGTDD209 pKa = 3.16NVNYY213 pKa = 10.0GFVYY217 pKa = 10.21LYY219 pKa = 10.47SGHH222 pKa = 7.54DD223 pKa = 3.89LTTLADD229 pKa = 3.82DD230 pKa = 4.81HH231 pKa = 7.06DD232 pKa = 4.33QGAAGAPEE240 pKa = 4.56GASIPVASMAVTLSDD255 pKa = 4.27DD256 pKa = 4.26ADD258 pKa = 4.02PATTDD263 pKa = 3.05PYY265 pKa = 10.25TYY267 pKa = 10.95KK268 pKa = 10.66FGLLMPGDD276 pKa = 3.7YY277 pKa = 10.17TLAFSCDD284 pKa = 3.95GINDD288 pKa = 3.78LPEE291 pKa = 5.38SYY293 pKa = 10.5EE294 pKa = 3.9GLTIPNPEE302 pKa = 4.0GLSYY306 pKa = 11.0EE307 pKa = 4.22LTLTDD312 pKa = 5.74GGDD315 pKa = 3.4LTQDD319 pKa = 3.13INSLSTGLL327 pKa = 3.8
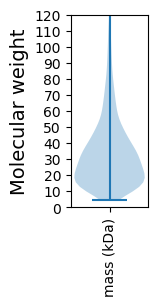
Molecular weight: 34.17 kDa
Isoelectric point according different methods:
Protein with the highest isoelectric point:
>tr|K2JLP1|K2JLP1_9GAMM Smr domain-containing protein OS=Gallaecimonas xiamenensis 3-C-1 OX=745411 GN=B3C1_04950 PE=4 SV=1
MM1 pKa = 7.14QRR3 pKa = 11.84TFQPSVIKK11 pKa = 10.49RR12 pKa = 11.84KK13 pKa = 9.2RR14 pKa = 11.84DD15 pKa = 3.06HH16 pKa = 6.58GFRR19 pKa = 11.84ARR21 pKa = 11.84MATKK25 pKa = 10.37NGRR28 pKa = 11.84KK29 pKa = 8.96VLARR33 pKa = 11.84RR34 pKa = 11.84RR35 pKa = 11.84AKK37 pKa = 10.39GRR39 pKa = 11.84ARR41 pKa = 11.84LSAA44 pKa = 3.91
MM1 pKa = 7.14QRR3 pKa = 11.84TFQPSVIKK11 pKa = 10.49RR12 pKa = 11.84KK13 pKa = 9.2RR14 pKa = 11.84DD15 pKa = 3.06HH16 pKa = 6.58GFRR19 pKa = 11.84ARR21 pKa = 11.84MATKK25 pKa = 10.37NGRR28 pKa = 11.84KK29 pKa = 8.96VLARR33 pKa = 11.84RR34 pKa = 11.84RR35 pKa = 11.84AKK37 pKa = 10.39GRR39 pKa = 11.84ARR41 pKa = 11.84LSAA44 pKa = 3.91
Molecular weight: 5.17 kDa
Isoelectric point according different methods:
Peptides (in silico digests for buttom-up proteomics)
Below you can find in silico digests of the whole proteome with Trypsin, Chymotrypsin, Trypsin+LysC, LysN, ArgC proteases suitable for different mass spec machines.| Try ESI |
 |
|---|
| ChTry ESI |
 |
|---|
| ArgC ESI |
 |
|---|
| LysN ESI |
 |
|---|
| TryLysC ESI |
 |
|---|
| Try MALDI |
 |
|---|
| ChTry MALDI |
 |
|---|
| ArgC MALDI |
 |
|---|
| LysN MALDI |
 |
|---|
| TryLysC MALDI |
 |
|---|
| Try LTQ |
 |
|---|
| ChTry LTQ |
 |
|---|
| ArgC LTQ |
 |
|---|
| LysN LTQ |
 |
|---|
| TryLysC LTQ |
 |
|---|
| Try MSlow |
 |
|---|
| ChTry MSlow |
 |
|---|
| ArgC MSlow |
 |
|---|
| LysN MSlow |
 |
|---|
| TryLysC MSlow |
 |
|---|
| Try MShigh |
 |
|---|
| ChTry MShigh |
 |
|---|
| ArgC MShigh |
 |
|---|
| LysN MShigh |
 |
|---|
| TryLysC MShigh |
 |
|---|
General Statistics
Number of major isoforms |
Number of additional isoforms |
Number of all proteins |
Number of amino acids |
Min. Seq. Length |
Max. Seq. Length |
Avg. Seq. Length |
Avg. Mol. Weight |
|---|---|---|---|---|---|---|---|
0 |
1224611 |
36 |
2797 |
322.4 |
35.34 |
Amino acid frequency
Ala |
Cys |
Asp |
Glu |
Phe |
Gly |
His |
Ile |
Lys |
Leu |
|---|---|---|---|---|---|---|---|---|---|
11.088 ± 0.051 | 0.934 ± 0.015 |
5.879 ± 0.039 | 5.332 ± 0.038 |
3.703 ± 0.028 | 8.122 ± 0.038 |
2.149 ± 0.021 | 4.252 ± 0.031 |
4.154 ± 0.035 | 12.322 ± 0.065 |
Met |
Asn |
Gln |
Pro |
Arg |
Ser |
Thr |
Val |
Trp |
Tyr |
|---|---|---|---|---|---|---|---|---|---|
2.298 ± 0.02 | 3.002 ± 0.027 |
4.705 ± 0.029 | 5.137 ± 0.035 |
5.562 ± 0.037 | 5.687 ± 0.035 |
4.574 ± 0.031 | 6.851 ± 0.031 |
1.533 ± 0.017 | 2.717 ± 0.023 |
Most of the basic statistics you can see at this page can be downloaded from this CSV file
Proteome-pI is available under Creative Commons Attribution-NoDerivs license, for more details see here
| Reference: Kozlowski LP. Proteome-pI 2.0: Proteome Isoelectric Point Database Update. Nucleic Acids Res. 2021, doi: 10.1093/nar/gkab944 | Contact: Lukasz P. Kozlowski |
