Beak and feather disease virus (BFDV)
Taxonomy: Viruses; Monodnaviria; Shotokuvirae; Cressdnaviricota; Arfiviricetes; Cirlivirales; Circoviridae; Circovirus
Average proteome isoelectric point is 8.48
Get precalculated fractions of proteins

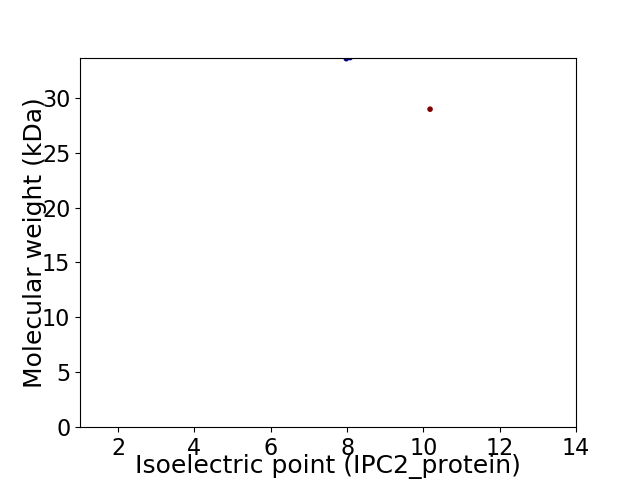
Virtual 2D-PAGE plot for 2 proteins (isoelectric point calculated using IPC2_protein)
Get csv file with sequences according to given criteria:
* You can choose from 21 different methods for calculating isoelectric point
Summary statistics related to proteome-wise predictions


Protein with the lowest isoelectric point:
>tr|A0A3Q8CWE0|A0A3Q8CWE0_BFDV ATP-dependent helicase Rep OS=Beak and feather disease virus OX=77856 GN=Rep PE=3 SV=1
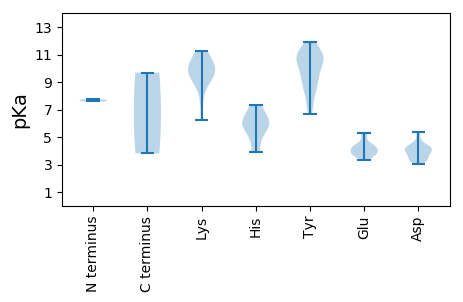
MM1 pKa = 7.59PSKK4 pKa = 10.45EE5 pKa = 3.95GSGCRR10 pKa = 11.84RR11 pKa = 11.84WCFTLNNPTDD21 pKa = 3.85GEE23 pKa = 4.42IEE25 pKa = 4.29FVRR28 pKa = 11.84SLGPDD33 pKa = 3.05EE34 pKa = 4.97FYY36 pKa = 10.98YY37 pKa = 11.01AIVGRR42 pKa = 11.84EE43 pKa = 4.0KK44 pKa = 11.1GEE46 pKa = 3.69QGTPHH51 pKa = 6.02LQGYY55 pKa = 7.3FHH57 pKa = 7.32FKK59 pKa = 9.42NKK61 pKa = 9.3KK62 pKa = 9.41RR63 pKa = 11.84LSALKK68 pKa = 10.2KK69 pKa = 9.75LLPRR73 pKa = 11.84AHH75 pKa = 6.9FEE77 pKa = 3.87RR78 pKa = 11.84AKK80 pKa = 11.12GSDD83 pKa = 3.4ADD85 pKa = 3.83NEE87 pKa = 4.57QYY89 pKa = 10.47CSKK92 pKa = 10.32EE93 pKa = 3.51GDD95 pKa = 3.64VILTLGIVARR105 pKa = 11.84DD106 pKa = 3.2GHH108 pKa = 6.21RR109 pKa = 11.84AFDD112 pKa = 3.73GAVAAVMSGRR122 pKa = 11.84KK123 pKa = 7.31MKK125 pKa = 10.31EE126 pKa = 3.65VARR129 pKa = 11.84EE130 pKa = 3.75FPEE133 pKa = 4.19VYY135 pKa = 9.73VRR137 pKa = 11.84HH138 pKa = 5.88GRR140 pKa = 11.84GLHH143 pKa = 5.46NLSLLVGSRR152 pKa = 11.84PRR154 pKa = 11.84DD155 pKa = 3.42FKK157 pKa = 11.18TEE159 pKa = 3.31VDD161 pKa = 4.22VIYY164 pKa = 10.46GPPGCGKK171 pKa = 10.27SRR173 pKa = 11.84WANEE177 pKa = 4.03QPGTKK182 pKa = 8.84YY183 pKa = 11.13YY184 pKa = 11.2KK185 pKa = 9.69MRR187 pKa = 11.84GEE189 pKa = 3.61WWDD192 pKa = 3.98GYY194 pKa = 11.01DD195 pKa = 4.14GEE197 pKa = 5.29DD198 pKa = 4.56VVILDD203 pKa = 5.37DD204 pKa = 4.22FYY206 pKa = 11.91GWLPYY211 pKa = 10.73CEE213 pKa = 4.27MLRR216 pKa = 11.84LCDD219 pKa = 4.27RR220 pKa = 11.84YY221 pKa = 9.16PHH223 pKa = 6.24KK224 pKa = 11.27VPVKK228 pKa = 8.87GAFVEE233 pKa = 5.24FTSKK237 pKa = 10.81RR238 pKa = 11.84IIITSNKK245 pKa = 9.26PPEE248 pKa = 3.83TWYY251 pKa = 10.87KK252 pKa = 10.18EE253 pKa = 4.29DD254 pKa = 4.32CDD256 pKa = 3.8PRR258 pKa = 11.84PLFRR262 pKa = 11.84RR263 pKa = 11.84FTRR266 pKa = 11.84VWWYY270 pKa = 10.97NVDD273 pKa = 3.17KK274 pKa = 11.07LEE276 pKa = 4.18QVRR279 pKa = 11.84PDD281 pKa = 4.09FLAHH285 pKa = 7.01PINYY289 pKa = 9.69
MM1 pKa = 7.59PSKK4 pKa = 10.45EE5 pKa = 3.95GSGCRR10 pKa = 11.84RR11 pKa = 11.84WCFTLNNPTDD21 pKa = 3.85GEE23 pKa = 4.42IEE25 pKa = 4.29FVRR28 pKa = 11.84SLGPDD33 pKa = 3.05EE34 pKa = 4.97FYY36 pKa = 10.98YY37 pKa = 11.01AIVGRR42 pKa = 11.84EE43 pKa = 4.0KK44 pKa = 11.1GEE46 pKa = 3.69QGTPHH51 pKa = 6.02LQGYY55 pKa = 7.3FHH57 pKa = 7.32FKK59 pKa = 9.42NKK61 pKa = 9.3KK62 pKa = 9.41RR63 pKa = 11.84LSALKK68 pKa = 10.2KK69 pKa = 9.75LLPRR73 pKa = 11.84AHH75 pKa = 6.9FEE77 pKa = 3.87RR78 pKa = 11.84AKK80 pKa = 11.12GSDD83 pKa = 3.4ADD85 pKa = 3.83NEE87 pKa = 4.57QYY89 pKa = 10.47CSKK92 pKa = 10.32EE93 pKa = 3.51GDD95 pKa = 3.64VILTLGIVARR105 pKa = 11.84DD106 pKa = 3.2GHH108 pKa = 6.21RR109 pKa = 11.84AFDD112 pKa = 3.73GAVAAVMSGRR122 pKa = 11.84KK123 pKa = 7.31MKK125 pKa = 10.31EE126 pKa = 3.65VARR129 pKa = 11.84EE130 pKa = 3.75FPEE133 pKa = 4.19VYY135 pKa = 9.73VRR137 pKa = 11.84HH138 pKa = 5.88GRR140 pKa = 11.84GLHH143 pKa = 5.46NLSLLVGSRR152 pKa = 11.84PRR154 pKa = 11.84DD155 pKa = 3.42FKK157 pKa = 11.18TEE159 pKa = 3.31VDD161 pKa = 4.22VIYY164 pKa = 10.46GPPGCGKK171 pKa = 10.27SRR173 pKa = 11.84WANEE177 pKa = 4.03QPGTKK182 pKa = 8.84YY183 pKa = 11.13YY184 pKa = 11.2KK185 pKa = 9.69MRR187 pKa = 11.84GEE189 pKa = 3.61WWDD192 pKa = 3.98GYY194 pKa = 11.01DD195 pKa = 4.14GEE197 pKa = 5.29DD198 pKa = 4.56VVILDD203 pKa = 5.37DD204 pKa = 4.22FYY206 pKa = 11.91GWLPYY211 pKa = 10.73CEE213 pKa = 4.27MLRR216 pKa = 11.84LCDD219 pKa = 4.27RR220 pKa = 11.84YY221 pKa = 9.16PHH223 pKa = 6.24KK224 pKa = 11.27VPVKK228 pKa = 8.87GAFVEE233 pKa = 5.24FTSKK237 pKa = 10.81RR238 pKa = 11.84IIITSNKK245 pKa = 9.26PPEE248 pKa = 3.83TWYY251 pKa = 10.87KK252 pKa = 10.18EE253 pKa = 4.29DD254 pKa = 4.32CDD256 pKa = 3.8PRR258 pKa = 11.84PLFRR262 pKa = 11.84RR263 pKa = 11.84FTRR266 pKa = 11.84VWWYY270 pKa = 10.97NVDD273 pKa = 3.17KK274 pKa = 11.07LEE276 pKa = 4.18QVRR279 pKa = 11.84PDD281 pKa = 4.09FLAHH285 pKa = 7.01PINYY289 pKa = 9.69
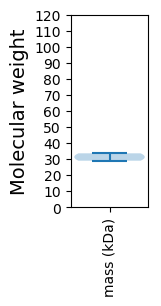
Molecular weight: 33.56 kDa
Isoelectric point according different methods:
Protein with the highest isoelectric point:
>tr|A0A3Q8CWE0|A0A3Q8CWE0_BFDV ATP-dependent helicase Rep OS=Beak and feather disease virus OX=77856 GN=Rep PE=3 SV=1
MM1 pKa = 7.74WGTSNCACATFQIRR15 pKa = 11.84RR16 pKa = 11.84RR17 pKa = 11.84YY18 pKa = 8.12ARR20 pKa = 11.84PYY22 pKa = 8.65RR23 pKa = 11.84RR24 pKa = 11.84RR25 pKa = 11.84HH26 pKa = 4.1IRR28 pKa = 11.84RR29 pKa = 11.84YY30 pKa = 8.2RR31 pKa = 11.84RR32 pKa = 11.84RR33 pKa = 11.84RR34 pKa = 11.84RR35 pKa = 11.84HH36 pKa = 3.92FRR38 pKa = 11.84RR39 pKa = 11.84RR40 pKa = 11.84RR41 pKa = 11.84FSTNRR46 pKa = 11.84IYY48 pKa = 10.22TLRR51 pKa = 11.84LTRR54 pKa = 11.84QFQFKK59 pKa = 10.12INKK62 pKa = 6.25QTTSVGNLIFNADD75 pKa = 4.35YY76 pKa = 9.29ITFALDD82 pKa = 3.74DD83 pKa = 4.14FLQAVPNPHH92 pKa = 6.1TLNFEE97 pKa = 4.33DD98 pKa = 5.0YY99 pKa = 9.96RR100 pKa = 11.84IKK102 pKa = 10.03LAKK105 pKa = 9.51MEE107 pKa = 3.87MRR109 pKa = 11.84PTGGHH114 pKa = 4.99YY115 pKa = 9.08TVQSDD120 pKa = 4.41GFGHH124 pKa = 6.0TAVIQDD130 pKa = 3.41SRR132 pKa = 11.84ITRR135 pKa = 11.84FKK137 pKa = 8.59TTADD141 pKa = 3.34QTQDD145 pKa = 3.2PLAPFDD151 pKa = 4.02GAKK154 pKa = 9.61KK155 pKa = 8.9WFVSRR160 pKa = 11.84GFKK163 pKa = 10.32RR164 pKa = 11.84LLRR167 pKa = 11.84PKK169 pKa = 9.82PQITIEE175 pKa = 4.38DD176 pKa = 4.19LTTANQSAALWLNSARR192 pKa = 11.84TGWIPLQGGPNSAGTKK208 pKa = 8.03VRR210 pKa = 11.84HH211 pKa = 5.36YY212 pKa = 10.73GIAFSFPQPEE222 pKa = 3.77QTITYY227 pKa = 6.7VTKK230 pKa = 9.7LTLYY234 pKa = 9.08VQFRR238 pKa = 11.84QFAPNNPSTT247 pKa = 3.82
MM1 pKa = 7.74WGTSNCACATFQIRR15 pKa = 11.84RR16 pKa = 11.84RR17 pKa = 11.84YY18 pKa = 8.12ARR20 pKa = 11.84PYY22 pKa = 8.65RR23 pKa = 11.84RR24 pKa = 11.84RR25 pKa = 11.84HH26 pKa = 4.1IRR28 pKa = 11.84RR29 pKa = 11.84YY30 pKa = 8.2RR31 pKa = 11.84RR32 pKa = 11.84RR33 pKa = 11.84RR34 pKa = 11.84RR35 pKa = 11.84HH36 pKa = 3.92FRR38 pKa = 11.84RR39 pKa = 11.84RR40 pKa = 11.84RR41 pKa = 11.84FSTNRR46 pKa = 11.84IYY48 pKa = 10.22TLRR51 pKa = 11.84LTRR54 pKa = 11.84QFQFKK59 pKa = 10.12INKK62 pKa = 6.25QTTSVGNLIFNADD75 pKa = 4.35YY76 pKa = 9.29ITFALDD82 pKa = 3.74DD83 pKa = 4.14FLQAVPNPHH92 pKa = 6.1TLNFEE97 pKa = 4.33DD98 pKa = 5.0YY99 pKa = 9.96RR100 pKa = 11.84IKK102 pKa = 10.03LAKK105 pKa = 9.51MEE107 pKa = 3.87MRR109 pKa = 11.84PTGGHH114 pKa = 4.99YY115 pKa = 9.08TVQSDD120 pKa = 4.41GFGHH124 pKa = 6.0TAVIQDD130 pKa = 3.41SRR132 pKa = 11.84ITRR135 pKa = 11.84FKK137 pKa = 8.59TTADD141 pKa = 3.34QTQDD145 pKa = 3.2PLAPFDD151 pKa = 4.02GAKK154 pKa = 9.61KK155 pKa = 8.9WFVSRR160 pKa = 11.84GFKK163 pKa = 10.32RR164 pKa = 11.84LLRR167 pKa = 11.84PKK169 pKa = 9.82PQITIEE175 pKa = 4.38DD176 pKa = 4.19LTTANQSAALWLNSARR192 pKa = 11.84TGWIPLQGGPNSAGTKK208 pKa = 8.03VRR210 pKa = 11.84HH211 pKa = 5.36YY212 pKa = 10.73GIAFSFPQPEE222 pKa = 3.77QTITYY227 pKa = 6.7VTKK230 pKa = 9.7LTLYY234 pKa = 9.08VQFRR238 pKa = 11.84QFAPNNPSTT247 pKa = 3.82
Molecular weight: 28.96 kDa
Isoelectric point according different methods:
Peptides (in silico digests for buttom-up proteomics)
Below you can find in silico digests of the whole proteome with Trypsin, Chymotrypsin, Trypsin+LysC, LysN, ArgC proteases suitable for different mass spec machines.| Try ESI |
 |
|---|
| ChTry ESI |
 |
|---|
| ArgC ESI |
 |
|---|
| LysN ESI |
 |
|---|
| TryLysC ESI |
 |
|---|
| Try MALDI |
 |
|---|
| ChTry MALDI |
 |
|---|
| ArgC MALDI |
 |
|---|
| LysN MALDI |
 |
|---|
| TryLysC MALDI |
 |
|---|
| Try LTQ |
 |
|---|
| ChTry LTQ |
 |
|---|
| ArgC LTQ |
 |
|---|
| LysN LTQ |
 |
|---|
| TryLysC LTQ |
 |
|---|
| Try MSlow |
 |
|---|
| ChTry MSlow |
 |
|---|
| ArgC MSlow |
 |
|---|
| LysN MSlow |
 |
|---|
| TryLysC MSlow |
 |
|---|
| Try MShigh |
 |
|---|
| ChTry MShigh |
 |
|---|
| ArgC MShigh |
 |
|---|
| LysN MShigh |
 |
|---|
| TryLysC MShigh |
 |
|---|
General Statistics
Number of major isoforms |
Number of additional isoforms |
Number of all proteins |
Number of amino acids |
Min. Seq. Length |
Max. Seq. Length |
Avg. Seq. Length |
Avg. Mol. Weight |
|---|---|---|---|---|---|---|---|
0 |
536 |
247 |
289 |
268.0 |
31.26 |
Amino acid frequency
Ala |
Cys |
Asp |
Glu |
Phe |
Gly |
His |
Ile |
Lys |
Leu |
|---|---|---|---|---|---|---|---|---|---|
5.97 ± 0.844 | 1.679 ± 0.557 |
5.41 ± 0.873 | 4.664 ± 1.952 |
6.157 ± 0.725 | 7.276 ± 1.29 |
2.612 ± 0.117 | 4.478 ± 0.763 |
5.97 ± 0.972 | 6.716 ± 0.153 |
Met |
Asn |
Gln |
Pro |
Arg |
Ser |
Thr |
Val |
Trp |
Tyr |
|---|---|---|---|---|---|---|---|---|---|
1.493 ± 0.178 | 3.918 ± 0.603 |
6.157 ± 0.313 | 3.918 ± 1.641 |
10.448 ± 1.348 | 4.291 ± 0.104 |
6.716 ± 2.442 | 5.224 ± 1.272 |
2.239 ± 0.397 | 4.664 ± 0.395 |
Most of the basic statistics you can see at this page can be downloaded from this CSV file
Proteome-pI is available under Creative Commons Attribution-NoDerivs license, for more details see here
| Reference: Kozlowski LP. Proteome-pI 2.0: Proteome Isoelectric Point Database Update. Nucleic Acids Res. 2021, doi: 10.1093/nar/gkab944 | Contact: Lukasz P. Kozlowski |
