Aeromonas virus 44RR2
Taxonomy: Viruses; Duplodnaviria; Heunggongvirae; Uroviricota; Caudoviricetes; Caudovirales; Myoviridae; Biquartavirus
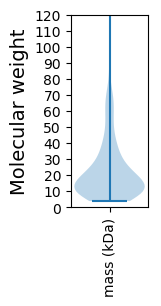
Average proteome isoelectric point is 6.07
Get precalculated fractions of proteins

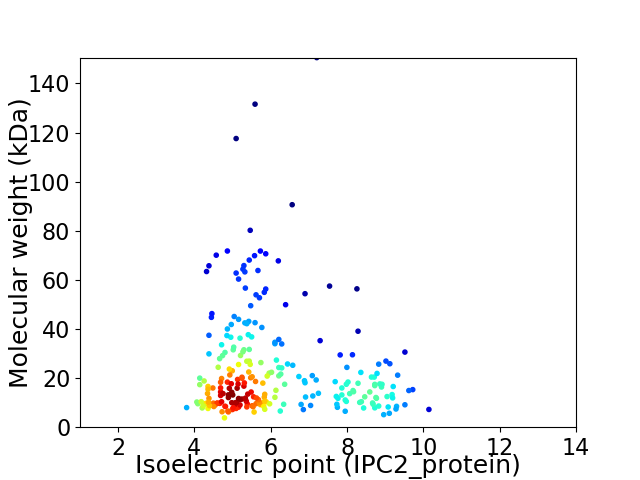
Virtual 2D-PAGE plot for 252 proteins (isoelectric point calculated using IPC2_protein)
Get csv file with sequences according to given criteria:
* You can choose from 21 different methods for calculating isoelectric point
Summary statistics related to proteome-wise predictions


Protein with the lowest isoelectric point:
>tr|Q6U9H7|Q6U9H7_9CAUD Uncharacterized protein OS=Aeromonas virus 44RR2 OX=115987 GN=44RRORF125c PE=4 SV=1
MM1 pKa = 7.94TDD3 pKa = 3.06QQEE6 pKa = 4.24LVMQFRR12 pKa = 11.84PSSTIKK18 pKa = 9.71IWCEE22 pKa = 3.41YY23 pKa = 10.3DD24 pKa = 2.88ISGQFGGNNNEE35 pKa = 4.05EE36 pKa = 4.43VVSITFPEE44 pKa = 4.32HH45 pKa = 4.6VQEE48 pKa = 4.18NEE50 pKa = 3.7RR51 pKa = 11.84NGYY54 pKa = 9.31IEE56 pKa = 5.63DD57 pKa = 3.7VVLTYY62 pKa = 8.99VQKK65 pKa = 8.29MTYY68 pKa = 10.08EE69 pKa = 4.46DD70 pKa = 4.11ADD72 pKa = 4.07SLEE75 pKa = 4.2GLYY78 pKa = 10.49GWEE81 pKa = 5.04HH82 pKa = 7.41IDD84 pKa = 4.45IVNLL88 pKa = 3.6
MM1 pKa = 7.94TDD3 pKa = 3.06QQEE6 pKa = 4.24LVMQFRR12 pKa = 11.84PSSTIKK18 pKa = 9.71IWCEE22 pKa = 3.41YY23 pKa = 10.3DD24 pKa = 2.88ISGQFGGNNNEE35 pKa = 4.05EE36 pKa = 4.43VVSITFPEE44 pKa = 4.32HH45 pKa = 4.6VQEE48 pKa = 4.18NEE50 pKa = 3.7RR51 pKa = 11.84NGYY54 pKa = 9.31IEE56 pKa = 5.63DD57 pKa = 3.7VVLTYY62 pKa = 8.99VQKK65 pKa = 8.29MTYY68 pKa = 10.08EE69 pKa = 4.46DD70 pKa = 4.11ADD72 pKa = 4.07SLEE75 pKa = 4.2GLYY78 pKa = 10.49GWEE81 pKa = 5.04HH82 pKa = 7.41IDD84 pKa = 4.45IVNLL88 pKa = 3.6
Molecular weight: 10.25 kDa
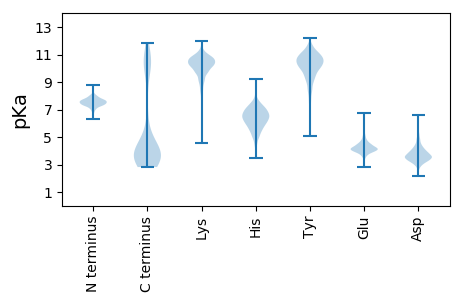
Isoelectric point according different methods:
Protein with the highest isoelectric point:
>tr|Q6U9E5|Q6U9E5_9CAUD Prohead core protein OS=Aeromonas virus 44RR2 OX=115987 GN=67 PE=4 SV=1
MM1 pKa = 7.96LIPSDD6 pKa = 4.48YY7 pKa = 10.26IAEE10 pKa = 4.2AVKK13 pKa = 10.4IEE15 pKa = 4.25AVMADD20 pKa = 2.73ATFRR24 pKa = 11.84VNHH27 pKa = 5.66LVEE30 pKa = 4.89SGFATDD36 pKa = 4.72EE37 pKa = 4.02IVGVISRR44 pKa = 11.84VAASEE49 pKa = 3.84PDD51 pKa = 3.2MAIAMISVVEE61 pKa = 4.22STSIDD66 pKa = 3.55EE67 pKa = 5.51AIVKK71 pKa = 9.52HH72 pKa = 5.4VNSRR76 pKa = 11.84GEE78 pKa = 3.65ITRR81 pKa = 11.84TKK83 pKa = 10.93DD84 pKa = 2.54RR85 pKa = 11.84ATRR88 pKa = 11.84KK89 pKa = 9.63RR90 pKa = 11.84NAFATTGLTASTRR103 pKa = 11.84RR104 pKa = 11.84QIARR108 pKa = 11.84RR109 pKa = 11.84AAKK112 pKa = 9.18TKK114 pKa = 10.08RR115 pKa = 11.84ANPSISVKK123 pKa = 10.17AQRR126 pKa = 11.84KK127 pKa = 4.72TKK129 pKa = 10.23RR130 pKa = 11.84ALKK133 pKa = 9.79RR134 pKa = 11.84RR135 pKa = 11.84KK136 pKa = 9.77ALGLL140 pKa = 3.7
MM1 pKa = 7.96LIPSDD6 pKa = 4.48YY7 pKa = 10.26IAEE10 pKa = 4.2AVKK13 pKa = 10.4IEE15 pKa = 4.25AVMADD20 pKa = 2.73ATFRR24 pKa = 11.84VNHH27 pKa = 5.66LVEE30 pKa = 4.89SGFATDD36 pKa = 4.72EE37 pKa = 4.02IVGVISRR44 pKa = 11.84VAASEE49 pKa = 3.84PDD51 pKa = 3.2MAIAMISVVEE61 pKa = 4.22STSIDD66 pKa = 3.55EE67 pKa = 5.51AIVKK71 pKa = 9.52HH72 pKa = 5.4VNSRR76 pKa = 11.84GEE78 pKa = 3.65ITRR81 pKa = 11.84TKK83 pKa = 10.93DD84 pKa = 2.54RR85 pKa = 11.84ATRR88 pKa = 11.84KK89 pKa = 9.63RR90 pKa = 11.84NAFATTGLTASTRR103 pKa = 11.84RR104 pKa = 11.84QIARR108 pKa = 11.84RR109 pKa = 11.84AAKK112 pKa = 9.18TKK114 pKa = 10.08RR115 pKa = 11.84ANPSISVKK123 pKa = 10.17AQRR126 pKa = 11.84KK127 pKa = 4.72TKK129 pKa = 10.23RR130 pKa = 11.84ALKK133 pKa = 9.79RR134 pKa = 11.84RR135 pKa = 11.84KK136 pKa = 9.77ALGLL140 pKa = 3.7
Molecular weight: 15.3 kDa
Isoelectric point according different methods:
Peptides (in silico digests for buttom-up proteomics)
Below you can find in silico digests of the whole proteome with Trypsin, Chymotrypsin, Trypsin+LysC, LysN, ArgC proteases suitable for different mass spec machines.| Try ESI |
 |
|---|
| ChTry ESI |
 |
|---|
| ArgC ESI |
 |
|---|
| LysN ESI |
 |
|---|
| TryLysC ESI |
 |
|---|
| Try MALDI |
 |
|---|
| ChTry MALDI |
 |
|---|
| ArgC MALDI |
 |
|---|
| LysN MALDI |
 |
|---|
| TryLysC MALDI |
 |
|---|
| Try LTQ |
 |
|---|
| ChTry LTQ |
 |
|---|
| ArgC LTQ |
 |
|---|
| LysN LTQ |
 |
|---|
| TryLysC LTQ |
 |
|---|
| Try MSlow |
 |
|---|
| ChTry MSlow |
 |
|---|
| ArgC MSlow |
 |
|---|
| LysN MSlow |
 |
|---|
| TryLysC MSlow |
 |
|---|
| Try MShigh |
 |
|---|
| ChTry MShigh |
 |
|---|
| ArgC MShigh |
 |
|---|
| LysN MShigh |
 |
|---|
| TryLysC MShigh |
 |
|---|
General Statistics
Number of major isoforms |
Number of additional isoforms |
Number of all proteins |
Number of amino acids |
Min. Seq. Length |
Max. Seq. Length |
Avg. Seq. Length |
Avg. Mol. Weight |
|---|---|---|---|---|---|---|---|
0 |
53462 |
32 |
1420 |
212.2 |
23.95 |
Amino acid frequency
Ala |
Cys |
Asp |
Glu |
Phe |
Gly |
His |
Ile |
Lys |
Leu |
|---|---|---|---|---|---|---|---|---|---|
7.241 ± 0.205 | 1.143 ± 0.065 |
6.41 ± 0.126 | 6.818 ± 0.217 |
4.523 ± 0.119 | 6.625 ± 0.204 |
2.076 ± 0.083 | 7.057 ± 0.142 |
6.586 ± 0.198 | 7.162 ± 0.124 |
Met |
Asn |
Gln |
Pro |
Arg |
Ser |
Thr |
Val |
Trp |
Tyr |
|---|---|---|---|---|---|---|---|---|---|
3.114 ± 0.102 | 5.318 ± 0.123 |
3.646 ± 0.086 | 3.421 ± 0.093 |
4.807 ± 0.101 | 6.272 ± 0.148 |
5.709 ± 0.198 | 6.779 ± 0.126 |
1.429 ± 0.07 | 3.864 ± 0.102 |
Most of the basic statistics you can see at this page can be downloaded from this CSV file
Proteome-pI is available under Creative Commons Attribution-NoDerivs license, for more details see here
| Reference: Kozlowski LP. Proteome-pI 2.0: Proteome Isoelectric Point Database Update. Nucleic Acids Res. 2021, doi: 10.1093/nar/gkab944 | Contact: Lukasz P. Kozlowski |
