Wisteria badnavirus 1
Taxonomy: Viruses; Riboviria; Pararnavirae; Artverviricota; Revtraviricetes; Ortervirales; Caulimoviridae; Badnavirus
Average proteome isoelectric point is 6.16
Get precalculated fractions of proteins

Virtual 2D-PAGE plot for 4 proteins (isoelectric point calculated using IPC2_protein)
Get csv file with sequences according to given criteria:
* You can choose from 21 different methods for calculating isoelectric point
Summary statistics related to proteome-wise predictions


Protein with the lowest isoelectric point:
>tr|A0A1U9IRR3|A0A1U9IRR3_9VIRU ORF2 OS=Wisteria badnavirus 1 OX=1973265 PE=4 SV=1
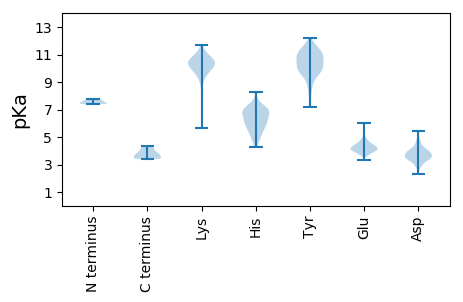
MM1 pKa = 7.57SRR3 pKa = 11.84EE4 pKa = 3.62EE5 pKa = 4.19DD6 pKa = 3.36YY7 pKa = 11.33KK8 pKa = 11.61AFLEE12 pKa = 4.39EE13 pKa = 4.42WNPDD17 pKa = 3.82PKK19 pKa = 11.02DD20 pKa = 3.55KK21 pKa = 10.79EE22 pKa = 4.77ANFLDD27 pKa = 4.59SILPEE32 pKa = 3.81PHH34 pKa = 6.65HH35 pKa = 6.81LNRR38 pKa = 11.84HH39 pKa = 5.38YY40 pKa = 11.53YY41 pKa = 10.08NLPCFHH47 pKa = 7.11LEE49 pKa = 4.21STAHH53 pKa = 5.2NHH55 pKa = 5.8SLGKK59 pKa = 10.23KK60 pKa = 8.99SSEE63 pKa = 4.09PTTSSQLDD71 pKa = 3.56LLLTLVHH78 pKa = 6.18NQSIHH83 pKa = 5.77YY84 pKa = 9.82DD85 pKa = 3.18RR86 pKa = 11.84TIRR89 pKa = 11.84FHH91 pKa = 6.34QAIFSQLEE99 pKa = 4.13RR100 pKa = 11.84IEE102 pKa = 4.33TRR104 pKa = 11.84LTTLEE109 pKa = 3.75ARR111 pKa = 11.84QPPTSNTNQTQTPKK125 pKa = 10.48PPRR128 pKa = 11.84KK129 pKa = 9.53EE130 pKa = 3.85YY131 pKa = 11.06LDD133 pKa = 3.56LFQRR137 pKa = 11.84LEE139 pKa = 4.07DD140 pKa = 3.5RR141 pKa = 11.84LKK143 pKa = 10.92AIEE146 pKa = 4.77DD147 pKa = 4.21NIPSS151 pKa = 3.5
MM1 pKa = 7.57SRR3 pKa = 11.84EE4 pKa = 3.62EE5 pKa = 4.19DD6 pKa = 3.36YY7 pKa = 11.33KK8 pKa = 11.61AFLEE12 pKa = 4.39EE13 pKa = 4.42WNPDD17 pKa = 3.82PKK19 pKa = 11.02DD20 pKa = 3.55KK21 pKa = 10.79EE22 pKa = 4.77ANFLDD27 pKa = 4.59SILPEE32 pKa = 3.81PHH34 pKa = 6.65HH35 pKa = 6.81LNRR38 pKa = 11.84HH39 pKa = 5.38YY40 pKa = 11.53YY41 pKa = 10.08NLPCFHH47 pKa = 7.11LEE49 pKa = 4.21STAHH53 pKa = 5.2NHH55 pKa = 5.8SLGKK59 pKa = 10.23KK60 pKa = 8.99SSEE63 pKa = 4.09PTTSSQLDD71 pKa = 3.56LLLTLVHH78 pKa = 6.18NQSIHH83 pKa = 5.77YY84 pKa = 9.82DD85 pKa = 3.18RR86 pKa = 11.84TIRR89 pKa = 11.84FHH91 pKa = 6.34QAIFSQLEE99 pKa = 4.13RR100 pKa = 11.84IEE102 pKa = 4.33TRR104 pKa = 11.84LTTLEE109 pKa = 3.75ARR111 pKa = 11.84QPPTSNTNQTQTPKK125 pKa = 10.48PPRR128 pKa = 11.84KK129 pKa = 9.53EE130 pKa = 3.85YY131 pKa = 11.06LDD133 pKa = 3.56LFQRR137 pKa = 11.84LEE139 pKa = 4.07DD140 pKa = 3.5RR141 pKa = 11.84LKK143 pKa = 10.92AIEE146 pKa = 4.77DD147 pKa = 4.21NIPSS151 pKa = 3.5
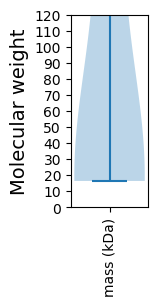
Molecular weight: 17.8 kDa
Isoelectric point according different methods:
Protein with the highest isoelectric point:
>tr|A0A1U9IRR4|A0A1U9IRR4_9VIRU Reverse transcriptase OS=Wisteria badnavirus 1 OX=1973265 PE=4 SV=1
MM1 pKa = 7.42SSWISSSEE9 pKa = 3.78TSVYY13 pKa = 10.83KK14 pKa = 10.01DD15 pKa = 3.01TLEE18 pKa = 4.29AVSTLSGDD26 pKa = 3.63HH27 pKa = 6.57EE28 pKa = 4.86GGEE31 pKa = 4.58GFVKK35 pKa = 10.45PDD37 pKa = 3.41TLGSKK42 pKa = 10.83GITHH46 pKa = 6.84CVKK49 pKa = 10.56QNNFQIQILVQITKK63 pKa = 10.3RR64 pKa = 11.84LEE66 pKa = 4.65DD67 pKa = 3.37IQLLLEE73 pKa = 4.35KK74 pKa = 10.51QGEE77 pKa = 4.39RR78 pKa = 11.84INALEE83 pKa = 4.52KK84 pKa = 10.38EE85 pKa = 4.57VKK87 pKa = 8.67TLKK90 pKa = 9.78TADD93 pKa = 3.71FKK95 pKa = 11.65VPEE98 pKa = 4.53DD99 pKa = 4.49VIDD102 pKa = 4.62DD103 pKa = 3.92LTKK106 pKa = 10.62KK107 pKa = 10.12FAAIEE112 pKa = 3.9TSALKK117 pKa = 10.21KK118 pKa = 10.5AKK120 pKa = 10.26QKK122 pKa = 8.17VTKK125 pKa = 9.72EE126 pKa = 3.66KK127 pKa = 9.99TPFLIHH133 pKa = 6.91HH134 pKa = 7.26DD135 pKa = 3.88PYY137 pKa = 11.36EE138 pKa = 4.13LNKK141 pKa = 10.47SIKK144 pKa = 9.92RR145 pKa = 3.7
MM1 pKa = 7.42SSWISSSEE9 pKa = 3.78TSVYY13 pKa = 10.83KK14 pKa = 10.01DD15 pKa = 3.01TLEE18 pKa = 4.29AVSTLSGDD26 pKa = 3.63HH27 pKa = 6.57EE28 pKa = 4.86GGEE31 pKa = 4.58GFVKK35 pKa = 10.45PDD37 pKa = 3.41TLGSKK42 pKa = 10.83GITHH46 pKa = 6.84CVKK49 pKa = 10.56QNNFQIQILVQITKK63 pKa = 10.3RR64 pKa = 11.84LEE66 pKa = 4.65DD67 pKa = 3.37IQLLLEE73 pKa = 4.35KK74 pKa = 10.51QGEE77 pKa = 4.39RR78 pKa = 11.84INALEE83 pKa = 4.52KK84 pKa = 10.38EE85 pKa = 4.57VKK87 pKa = 8.67TLKK90 pKa = 9.78TADD93 pKa = 3.71FKK95 pKa = 11.65VPEE98 pKa = 4.53DD99 pKa = 4.49VIDD102 pKa = 4.62DD103 pKa = 3.92LTKK106 pKa = 10.62KK107 pKa = 10.12FAAIEE112 pKa = 3.9TSALKK117 pKa = 10.21KK118 pKa = 10.5AKK120 pKa = 10.26QKK122 pKa = 8.17VTKK125 pKa = 9.72EE126 pKa = 3.66KK127 pKa = 9.99TPFLIHH133 pKa = 6.91HH134 pKa = 7.26DD135 pKa = 3.88PYY137 pKa = 11.36EE138 pKa = 4.13LNKK141 pKa = 10.47SIKK144 pKa = 9.92RR145 pKa = 3.7
Molecular weight: 16.33 kDa
Isoelectric point according different methods:
Peptides (in silico digests for buttom-up proteomics)
Below you can find in silico digests of the whole proteome with Trypsin, Chymotrypsin, Trypsin+LysC, LysN, ArgC proteases suitable for different mass spec machines.| Try ESI |
 |
|---|
| ChTry ESI |
 |
|---|
| ArgC ESI |
 |
|---|
| LysN ESI |
 |
|---|
| TryLysC ESI |
 |
|---|
| Try MALDI |
 |
|---|
| ChTry MALDI |
 |
|---|
| ArgC MALDI |
 |
|---|
| LysN MALDI |
 |
|---|
| TryLysC MALDI |
 |
|---|
| Try LTQ |
 |
|---|
| ChTry LTQ |
 |
|---|
| ArgC LTQ |
 |
|---|
| LysN LTQ |
 |
|---|
| TryLysC LTQ |
 |
|---|
| Try MSlow |
 |
|---|
| ChTry MSlow |
 |
|---|
| ArgC MSlow |
 |
|---|
| LysN MSlow |
 |
|---|
| TryLysC MSlow |
 |
|---|
| Try MShigh |
 |
|---|
| ChTry MShigh |
 |
|---|
| ArgC MShigh |
 |
|---|
| LysN MShigh |
 |
|---|
| TryLysC MShigh |
 |
|---|
General Statistics
Number of major isoforms |
Number of additional isoforms |
Number of all proteins |
Number of amino acids |
Min. Seq. Length |
Max. Seq. Length |
Avg. Seq. Length |
Avg. Mol. Weight |
|---|---|---|---|---|---|---|---|
0 |
2357 |
145 |
1909 |
589.3 |
66.8 |
Amino acid frequency
Ala |
Cys |
Asp |
Glu |
Phe |
Gly |
His |
Ile |
Lys |
Leu |
|---|---|---|---|---|---|---|---|---|---|
6.152 ± 0.61 | 1.782 ± 0.334 |
5.049 ± 0.33 | 8.316 ± 0.329 |
3.649 ± 0.093 | 6.279 ± 1.34 |
2.164 ± 0.981 | 6.406 ± 0.494 |
6.831 ± 1.256 | 8.188 ± 1.068 |
Met |
Asn |
Gln |
Pro |
Arg |
Ser |
Thr |
Val |
Trp |
Tyr |
|---|---|---|---|---|---|---|---|---|---|
2.206 ± 0.459 | 4.54 ± 0.396 |
4.922 ± 0.716 | 5.6 ± 0.245 |
5.643 ± 0.737 | 6.406 ± 0.522 |
6.067 ± 1.368 | 5.431 ± 1.398 |
1.358 ± 0.474 | 3.012 ± 0.304 |
Most of the basic statistics you can see at this page can be downloaded from this CSV file
Proteome-pI is available under Creative Commons Attribution-NoDerivs license, for more details see here
| Reference: Kozlowski LP. Proteome-pI 2.0: Proteome Isoelectric Point Database Update. Nucleic Acids Res. 2021, doi: 10.1093/nar/gkab944 | Contact: Lukasz P. Kozlowski |
