Sediminicola sp. YIK13
Taxonomy: cellular organisms; Bacteria; FCB group; Bacteroidetes/Chlorobi group; Bacteroidetes; Flavobacteriia; Flavobacteriales; Flavobacteriaceae; Sediminicola; unclassified Sediminicola
Average proteome isoelectric point is 6.4
Get precalculated fractions of proteins

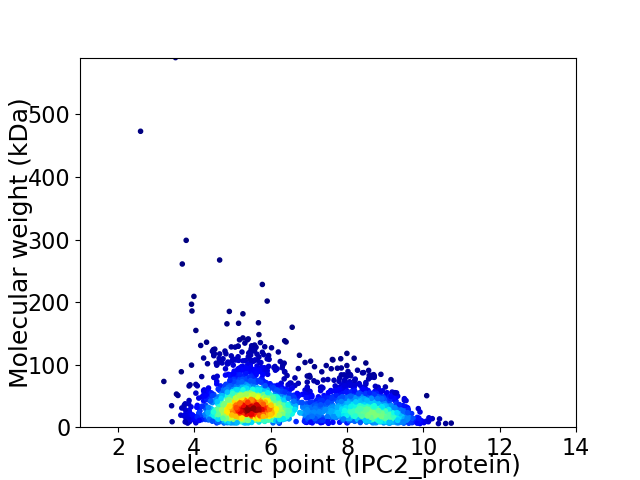
Virtual 2D-PAGE plot for 2966 proteins (isoelectric point calculated using IPC2_protein)
Get csv file with sequences according to given criteria:
* You can choose from 21 different methods for calculating isoelectric point
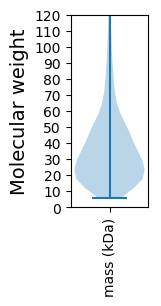
Summary statistics related to proteome-wise predictions


Protein with the lowest isoelectric point:
>tr|A0A0S1SDI8|A0A0S1SDI8_9FLAO X-Pro aminopeptidase OS=Sediminicola sp. YIK13 OX=1453352 GN=SB49_11605 PE=4 SV=1
MM1 pKa = 7.5KK2 pKa = 10.37KK3 pKa = 9.61ILLKK7 pKa = 10.53ISIVALALITLGCSSEE23 pKa = 4.84DD24 pKa = 3.45NVIDD28 pKa = 3.58IVSRR32 pKa = 11.84DD33 pKa = 3.82LSTEE37 pKa = 3.99LPFLRR42 pKa = 11.84ITSQTGRR49 pKa = 11.84SLNLFDD55 pKa = 4.48TEE57 pKa = 3.98STYY60 pKa = 10.76TVNFEE65 pKa = 4.09YY66 pKa = 11.06QEE68 pKa = 4.19VEE70 pKa = 3.8NTAVMDD76 pKa = 3.27QFEE79 pKa = 4.46RR80 pKa = 11.84VDD82 pKa = 3.81FTINFIDD89 pKa = 3.83NFEE92 pKa = 5.04DD93 pKa = 4.55GVDD96 pKa = 3.5NSKK99 pKa = 11.0AAVSLGSLSKK109 pKa = 10.89SDD111 pKa = 4.56FSALSSFGMPTSSFDD126 pKa = 3.57YY127 pKa = 10.63TFGEE131 pKa = 4.33ALTALGLTTAQVNGGDD147 pKa = 3.44QFQLNWEE154 pKa = 4.34LFLTDD159 pKa = 3.94GSSINSSDD167 pKa = 3.38VSGNISAVGGYY178 pKa = 9.74YY179 pKa = 10.14SAPYY183 pKa = 9.5QSRR186 pKa = 11.84AAMVCLFDD194 pKa = 4.77APEE197 pKa = 4.17FFVGDD202 pKa = 3.7YY203 pKa = 10.94QMEE206 pKa = 4.39QLTGADD212 pKa = 3.67PFYY215 pKa = 11.27GDD217 pKa = 3.86EE218 pKa = 4.3TFGTQVVTLTATGATQRR235 pKa = 11.84QFNFLYY241 pKa = 10.8YY242 pKa = 10.06PGNFDD247 pKa = 3.5TNYY250 pKa = 8.39TFTMNFVCDD259 pKa = 4.71RR260 pKa = 11.84ISMVGTGGLGCGGSIGQTTGDD281 pKa = 3.51TPTFFDD287 pKa = 4.17QNLVDD292 pKa = 4.14DD293 pKa = 5.05AEE295 pKa = 5.79IILSITDD302 pKa = 3.69FDD304 pKa = 5.05GDD306 pKa = 4.18GGCGTGSNQITVRR319 pKa = 11.84LTKK322 pKa = 10.68LL323 pKa = 3.06
MM1 pKa = 7.5KK2 pKa = 10.37KK3 pKa = 9.61ILLKK7 pKa = 10.53ISIVALALITLGCSSEE23 pKa = 4.84DD24 pKa = 3.45NVIDD28 pKa = 3.58IVSRR32 pKa = 11.84DD33 pKa = 3.82LSTEE37 pKa = 3.99LPFLRR42 pKa = 11.84ITSQTGRR49 pKa = 11.84SLNLFDD55 pKa = 4.48TEE57 pKa = 3.98STYY60 pKa = 10.76TVNFEE65 pKa = 4.09YY66 pKa = 11.06QEE68 pKa = 4.19VEE70 pKa = 3.8NTAVMDD76 pKa = 3.27QFEE79 pKa = 4.46RR80 pKa = 11.84VDD82 pKa = 3.81FTINFIDD89 pKa = 3.83NFEE92 pKa = 5.04DD93 pKa = 4.55GVDD96 pKa = 3.5NSKK99 pKa = 11.0AAVSLGSLSKK109 pKa = 10.89SDD111 pKa = 4.56FSALSSFGMPTSSFDD126 pKa = 3.57YY127 pKa = 10.63TFGEE131 pKa = 4.33ALTALGLTTAQVNGGDD147 pKa = 3.44QFQLNWEE154 pKa = 4.34LFLTDD159 pKa = 3.94GSSINSSDD167 pKa = 3.38VSGNISAVGGYY178 pKa = 9.74YY179 pKa = 10.14SAPYY183 pKa = 9.5QSRR186 pKa = 11.84AAMVCLFDD194 pKa = 4.77APEE197 pKa = 4.17FFVGDD202 pKa = 3.7YY203 pKa = 10.94QMEE206 pKa = 4.39QLTGADD212 pKa = 3.67PFYY215 pKa = 11.27GDD217 pKa = 3.86EE218 pKa = 4.3TFGTQVVTLTATGATQRR235 pKa = 11.84QFNFLYY241 pKa = 10.8YY242 pKa = 10.06PGNFDD247 pKa = 3.5TNYY250 pKa = 8.39TFTMNFVCDD259 pKa = 4.71RR260 pKa = 11.84ISMVGTGGLGCGGSIGQTTGDD281 pKa = 3.51TPTFFDD287 pKa = 4.17QNLVDD292 pKa = 4.14DD293 pKa = 5.05AEE295 pKa = 5.79IILSITDD302 pKa = 3.69FDD304 pKa = 5.05GDD306 pKa = 4.18GGCGTGSNQITVRR319 pKa = 11.84LTKK322 pKa = 10.68LL323 pKa = 3.06
Molecular weight: 34.96 kDa
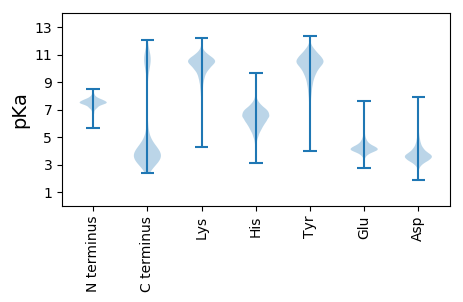
Isoelectric point according different methods:
Protein with the highest isoelectric point:
>tr|A0A0S1SA06|A0A0S1SA06_9FLAO Endoribonuclease L-PSP OS=Sediminicola sp. YIK13 OX=1453352 GN=SB49_01325 PE=4 SV=1
MM1 pKa = 7.33VLRR4 pKa = 11.84KK5 pKa = 9.65GCRR8 pKa = 11.84FAARR12 pKa = 11.84NNEE15 pKa = 3.74GCGGKK20 pKa = 9.67NGRR23 pKa = 11.84KK24 pKa = 9.1AVFIEE29 pKa = 4.43GSGAAKK35 pKa = 10.14EE36 pKa = 3.98KK37 pKa = 10.22RR38 pKa = 11.84KK39 pKa = 10.54KK40 pKa = 10.7FFIFYY45 pKa = 10.51LRR47 pKa = 11.84GTKK50 pKa = 9.6RR51 pKa = 11.84VVYY54 pKa = 7.85LHH56 pKa = 6.49PLWEE60 pKa = 4.27TEE62 pKa = 3.98RR63 pKa = 11.84QNKK66 pKa = 8.26NKK68 pKa = 9.46NRR70 pKa = 11.84QVLL73 pKa = 3.59
MM1 pKa = 7.33VLRR4 pKa = 11.84KK5 pKa = 9.65GCRR8 pKa = 11.84FAARR12 pKa = 11.84NNEE15 pKa = 3.74GCGGKK20 pKa = 9.67NGRR23 pKa = 11.84KK24 pKa = 9.1AVFIEE29 pKa = 4.43GSGAAKK35 pKa = 10.14EE36 pKa = 3.98KK37 pKa = 10.22RR38 pKa = 11.84KK39 pKa = 10.54KK40 pKa = 10.7FFIFYY45 pKa = 10.51LRR47 pKa = 11.84GTKK50 pKa = 9.6RR51 pKa = 11.84VVYY54 pKa = 7.85LHH56 pKa = 6.49PLWEE60 pKa = 4.27TEE62 pKa = 3.98RR63 pKa = 11.84QNKK66 pKa = 8.26NKK68 pKa = 9.46NRR70 pKa = 11.84QVLL73 pKa = 3.59
Molecular weight: 8.5 kDa
Isoelectric point according different methods:
Peptides (in silico digests for buttom-up proteomics)
Below you can find in silico digests of the whole proteome with Trypsin, Chymotrypsin, Trypsin+LysC, LysN, ArgC proteases suitable for different mass spec machines.| Try ESI |
 |
|---|
| ChTry ESI |
 |
|---|
| ArgC ESI |
 |
|---|
| LysN ESI |
 |
|---|
| TryLysC ESI |
 |
|---|
| Try MALDI |
 |
|---|
| ChTry MALDI |
 |
|---|
| ArgC MALDI |
 |
|---|
| LysN MALDI |
 |
|---|
| TryLysC MALDI |
 |
|---|
| Try LTQ |
 |
|---|
| ChTry LTQ |
 |
|---|
| ArgC LTQ |
 |
|---|
| LysN LTQ |
 |
|---|
| TryLysC LTQ |
 |
|---|
| Try MSlow |
 |
|---|
| ChTry MSlow |
 |
|---|
| ArgC MSlow |
 |
|---|
| LysN MSlow |
 |
|---|
| TryLysC MSlow |
 |
|---|
| Try MShigh |
 |
|---|
| ChTry MShigh |
 |
|---|
| ArgC MShigh |
 |
|---|
| LysN MShigh |
 |
|---|
| TryLysC MShigh |
 |
|---|
General Statistics
Number of major isoforms |
Number of additional isoforms |
Number of all proteins |
Number of amino acids |
Min. Seq. Length |
Max. Seq. Length |
Avg. Seq. Length |
Avg. Mol. Weight |
|---|---|---|---|---|---|---|---|
0 |
1011104 |
50 |
5634 |
340.9 |
38.34 |
Amino acid frequency
Ala |
Cys |
Asp |
Glu |
Phe |
Gly |
His |
Ile |
Lys |
Leu |
|---|---|---|---|---|---|---|---|---|---|
6.574 ± 0.046 | 0.691 ± 0.016 |
5.647 ± 0.052 | 6.701 ± 0.05 |
5.077 ± 0.038 | 6.802 ± 0.048 |
1.813 ± 0.023 | 7.72 ± 0.042 |
7.552 ± 0.074 | 9.522 ± 0.06 |
Met |
Asn |
Gln |
Pro |
Arg |
Ser |
Thr |
Val |
Trp |
Tyr |
|---|---|---|---|---|---|---|---|---|---|
2.399 ± 0.025 | 5.714 ± 0.049 |
3.497 ± 0.029 | 3.342 ± 0.024 |
3.518 ± 0.037 | 6.348 ± 0.036 |
5.749 ± 0.075 | 6.35 ± 0.036 |
1.046 ± 0.018 | 3.938 ± 0.03 |
Most of the basic statistics you can see at this page can be downloaded from this CSV file
Proteome-pI is available under Creative Commons Attribution-NoDerivs license, for more details see here
| Reference: Kozlowski LP. Proteome-pI 2.0: Proteome Isoelectric Point Database Update. Nucleic Acids Res. 2021, doi: 10.1093/nar/gkab944 | Contact: Lukasz P. Kozlowski |
