Staphylococcus phage 23MRA
Taxonomy: Viruses; Duplodnaviria; Heunggongvirae; Uroviricota; Caudoviricetes; Caudovirales; Siphoviridae; Bronfenbrennervirinae; Biseptimavirus; Staphylococcus virus 23MRA
Average proteome isoelectric point is 6.91
Get precalculated fractions of proteins
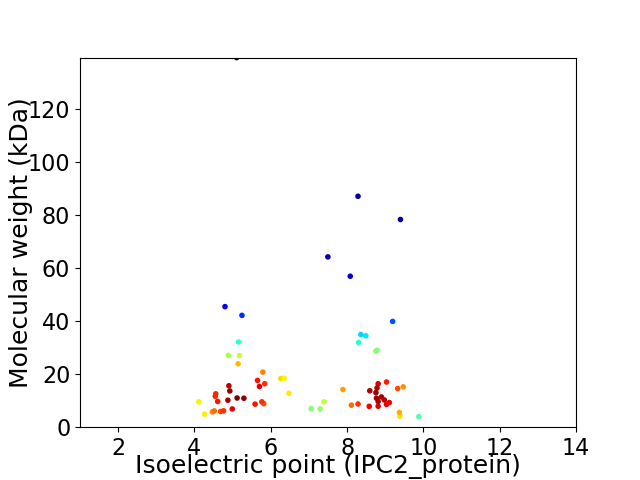
Virtual 2D-PAGE plot for 66 proteins (isoelectric point calculated using IPC2_protein)
Get csv file with sequences according to given criteria:
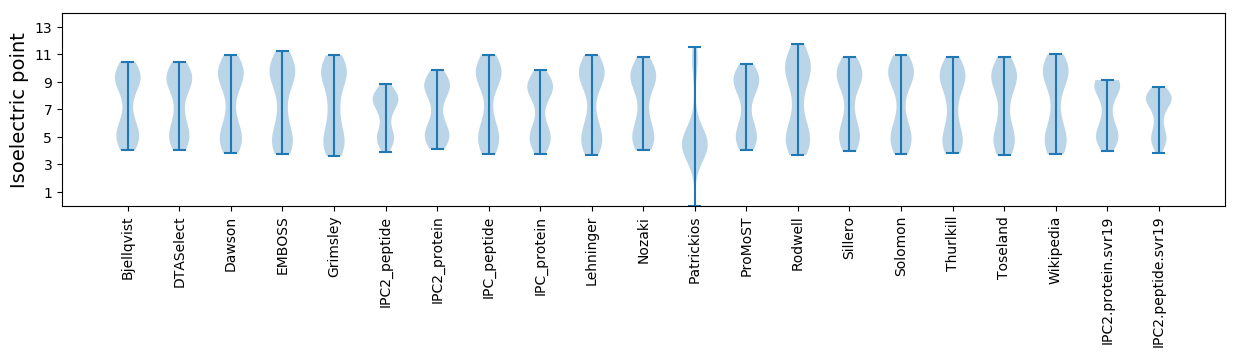
* You can choose from 21 different methods for calculating isoelectric point
Summary statistics related to proteome-wise predictions
Protein with the lowest isoelectric point:
>tr|A0A0H3U2U6|A0A0H3U2U6_9CAUD Uncharacterized protein OS=Staphylococcus phage 23MRA OX=1505027 PE=4 SV=1
MM1 pKa = 8.04AIQLIQEE8 pKa = 4.16LQVYY12 pKa = 8.67YY13 pKa = 10.28PITQLSNMTAHH24 pKa = 7.36IALMAIDD31 pKa = 4.85GLLILLIVDD40 pKa = 3.45NVVII44 pKa = 4.48
MM1 pKa = 8.04AIQLIQEE8 pKa = 4.16LQVYY12 pKa = 8.67YY13 pKa = 10.28PITQLSNMTAHH24 pKa = 7.36IALMAIDD31 pKa = 4.85GLLILLIVDD40 pKa = 3.45NVVII44 pKa = 4.48
Molecular weight: 4.91 kDa
Isoelectric point according different methods:
Protein with the highest isoelectric point:
>tr|A0A0H3U319|A0A0H3U319_9CAUD Anti-repressor OS=Staphylococcus phage 23MRA OX=1505027 PE=4 SV=1
MM1 pKa = 7.49KK2 pKa = 10.45NKK4 pKa = 10.06KK5 pKa = 9.71LLLASTSNSDD15 pKa = 3.43KK16 pKa = 11.0RR17 pKa = 11.84LTKK20 pKa = 10.51LIHH23 pKa = 5.8FQYY26 pKa = 9.13KK27 pKa = 8.44TKK29 pKa = 10.65QGGSQPP35 pKa = 3.58
MM1 pKa = 7.49KK2 pKa = 10.45NKK4 pKa = 10.06KK5 pKa = 9.71LLLASTSNSDD15 pKa = 3.43KK16 pKa = 11.0RR17 pKa = 11.84LTKK20 pKa = 10.51LIHH23 pKa = 5.8FQYY26 pKa = 9.13KK27 pKa = 8.44TKK29 pKa = 10.65QGGSQPP35 pKa = 3.58
Molecular weight: 3.99 kDa
Isoelectric point according different methods:
Peptides (in silico digests for buttom-up proteomics)
Below you can find in silico digests of the whole proteome with Trypsin, Chymotrypsin, Trypsin+LysC, LysN, ArgC proteases suitable for different mass spec machines.| Try ESI |
 |
|---|
| ChTry ESI |
|
|---|
| ArgC ESI |
|
|---|
| LysN ESI |
|
|---|
| TryLysC ESI |
|
|---|
| Try MALDI |
|
|---|
| ChTry MALDI |
|
|---|
| ArgC MALDI |
|
|---|
| LysN MALDI |
|
|---|
| TryLysC MALDI |
|
|---|
| Try LTQ |
|
|---|
| ChTry LTQ |
|
|---|
| ArgC LTQ |
|
|---|
| LysN LTQ |
|
|---|
| TryLysC LTQ |
|
|---|
| Try MSlow |
|
|---|
| ChTry MSlow |
|
|---|
| ArgC MSlow |
|
|---|
| LysN MSlow |
|
|---|
| TryLysC MSlow |
|
|---|
| Try MShigh |
|
|---|
| ChTry MShigh |
|
|---|
| ArgC MShigh |
|
|---|
| LysN MShigh |
|
|---|
| TryLysC MShigh |
|
|---|
General Statistics
Number of major isoforms |
Number of additional isoforms |
Number of all proteins |
Number of amino acids |
Min. Seq. Length |
Max. Seq. Length |
Avg. Seq. Length |
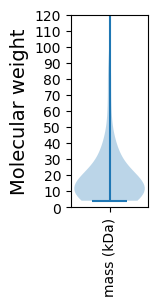
Avg. Mol. Weight |
|---|---|---|---|---|---|---|---|
0 |
11868 |
35 |
1225 |
179.8 |
20.62 |
Amino acid frequency
Ala |
Cys |
Asp |
Glu |
Phe |
Gly |
His |
Ile |
Lys |
Leu |
|---|---|---|---|---|---|---|---|---|---|
5.839 ± 0.357 | 0.43 ± 0.08 |
6.025 ± 0.342 | 7.609 ± 0.385 |
4.129 ± 0.318 | 5.654 ± 0.477 |
1.753 ± 0.194 | 7.701 ± 0.297 |
9.698 ± 0.369 | 8.434 ± 0.296 |
Met |
Asn |
Gln |
Pro |
Arg |
Ser |
Thr |
Val |
Trp |
Tyr |
|---|---|---|---|---|---|---|---|---|---|
2.671 ± 0.275 | 6.673 ± 0.248 |
2.629 ± 0.214 | 3.783 ± 0.257 |
4.348 ± 0.334 | 5.923 ± 0.283 |
5.671 ± 0.22 | 5.662 ± 0.238 |
1.129 ± 0.143 | 4.238 ± 0.301 |
Most of the basic statistics you can see at this page can be downloaded from this CSV file
See this proteome in:

Proteome-pI is available under Creative Commons Attribution-NoDerivs license, for more details see here
| Reference: Kozlowski LP. Proteome-pI 2.0: Proteome Isoelectric Point Database Update. Nucleic Acids Res. 2021, doi: 10.1093/nar/gkab944 | Contact: Lukasz P. Kozlowski |