Spiribacter sp. 2438
Taxonomy: cellular organisms; Bacteria; Proteobacteria; Gammaproteobacteria; Chromatiales; Ectothiorhodospiraceae; Spiribacter; unclassified Spiribacter
Average proteome isoelectric point is 6.12
Get precalculated fractions of proteins
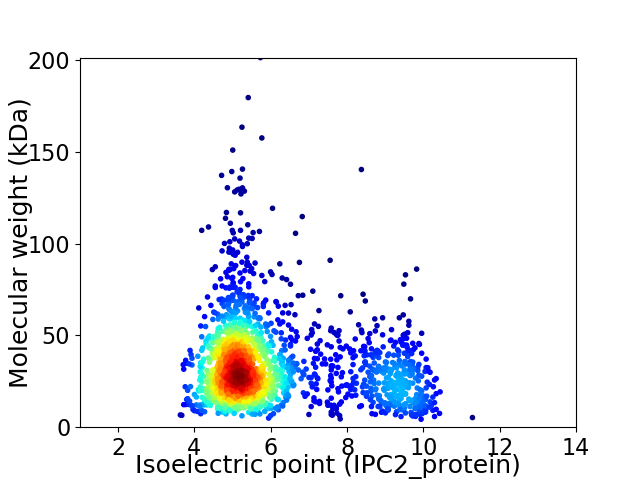
Virtual 2D-PAGE plot for 1830 proteins (isoelectric point calculated using IPC2_protein)
Get csv file with sequences according to given criteria:
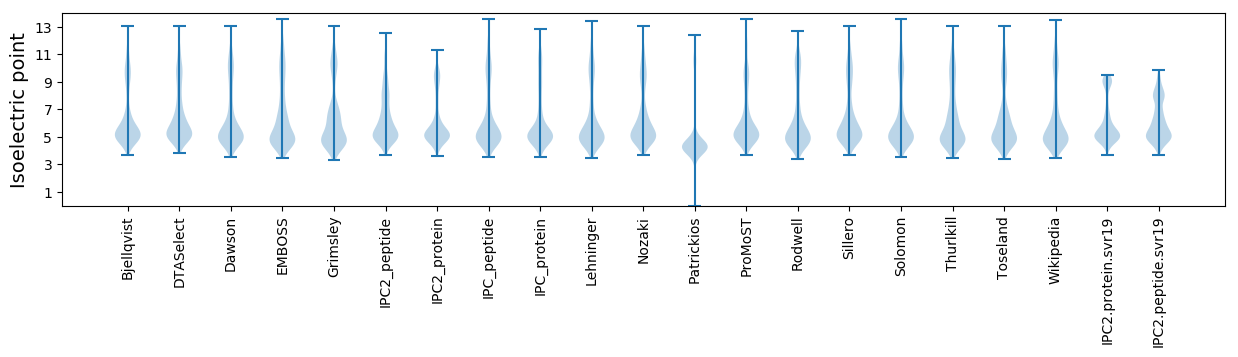
* You can choose from 21 different methods for calculating isoelectric point
Summary statistics related to proteome-wise predictions
Protein with the lowest isoelectric point:
>tr|A0A6B8JUZ3|A0A6B8JUZ3_9GAMM D-amino-acid transaminase OS=Spiribacter sp. 2438 OX=2666185 GN=GJ672_07040 PE=4 SV=1
MM1 pKa = 7.47SNRR4 pKa = 11.84TSRR7 pKa = 11.84MLLTGALGLAMAGGASAQDD26 pKa = 3.5DD27 pKa = 4.33TIEE30 pKa = 4.48FGWTAWSDD38 pKa = 3.66AEE40 pKa = 4.62FMTRR44 pKa = 11.84LAAQLVNDD52 pKa = 4.07HH53 pKa = 6.64TDD55 pKa = 2.98YY56 pKa = 11.26SADD59 pKa = 3.44MVQTDD64 pKa = 4.53IAPQFQGLATGDD76 pKa = 3.26IDD78 pKa = 4.71AMLMAWLPATHH89 pKa = 6.59EE90 pKa = 4.13EE91 pKa = 4.88YY92 pKa = 11.16YY93 pKa = 10.78EE94 pKa = 4.48GVADD98 pKa = 4.07DD99 pKa = 4.28VEE101 pKa = 4.48NLGVLYY107 pKa = 10.92NSARR111 pKa = 11.84LGWAVPTYY119 pKa = 10.77VPEE122 pKa = 4.6DD123 pKa = 3.51QLSSIEE129 pKa = 4.75DD130 pKa = 3.56LTDD133 pKa = 4.23DD134 pKa = 4.47SVQAEE139 pKa = 4.45LGGTITGIDD148 pKa = 3.65PGAGLTSLSEE158 pKa = 4.2QALEE162 pKa = 4.37TYY164 pKa = 10.84GLDD167 pKa = 4.52DD168 pKa = 3.7YY169 pKa = 11.4TLQTSSGAGMTAALDD184 pKa = 3.79RR185 pKa = 11.84AVGRR189 pKa = 11.84DD190 pKa = 3.14DD191 pKa = 4.21WIVVTGWSPHH201 pKa = 4.49WKK203 pKa = 9.81FGAYY207 pKa = 7.84EE208 pKa = 3.93LRR210 pKa = 11.84YY211 pKa = 10.44LEE213 pKa = 4.95DD214 pKa = 3.95PEE216 pKa = 4.75GALGGPEE223 pKa = 3.59RR224 pKa = 11.84VHH226 pKa = 7.2ALGRR230 pKa = 11.84AGFDD234 pKa = 2.87ADD236 pKa = 3.7YY237 pKa = 11.24PEE239 pKa = 4.71ISEE242 pKa = 4.34MLSRR246 pKa = 11.84MYY248 pKa = 11.01VPIDD252 pKa = 3.4EE253 pKa = 4.89LQDD256 pKa = 3.54YY257 pKa = 8.27MFEE260 pKa = 4.05ASEE263 pKa = 4.33TSFEE267 pKa = 4.34EE268 pKa = 4.23AVSAYY273 pKa = 9.7IDD275 pKa = 4.38DD276 pKa = 4.17NPDD279 pKa = 4.05RR280 pKa = 11.84IQYY283 pKa = 8.7WLTGEE288 pKa = 4.16LL289 pKa = 3.79
MM1 pKa = 7.47SNRR4 pKa = 11.84TSRR7 pKa = 11.84MLLTGALGLAMAGGASAQDD26 pKa = 3.5DD27 pKa = 4.33TIEE30 pKa = 4.48FGWTAWSDD38 pKa = 3.66AEE40 pKa = 4.62FMTRR44 pKa = 11.84LAAQLVNDD52 pKa = 4.07HH53 pKa = 6.64TDD55 pKa = 2.98YY56 pKa = 11.26SADD59 pKa = 3.44MVQTDD64 pKa = 4.53IAPQFQGLATGDD76 pKa = 3.26IDD78 pKa = 4.71AMLMAWLPATHH89 pKa = 6.59EE90 pKa = 4.13EE91 pKa = 4.88YY92 pKa = 11.16YY93 pKa = 10.78EE94 pKa = 4.48GVADD98 pKa = 4.07DD99 pKa = 4.28VEE101 pKa = 4.48NLGVLYY107 pKa = 10.92NSARR111 pKa = 11.84LGWAVPTYY119 pKa = 10.77VPEE122 pKa = 4.6DD123 pKa = 3.51QLSSIEE129 pKa = 4.75DD130 pKa = 3.56LTDD133 pKa = 4.23DD134 pKa = 4.47SVQAEE139 pKa = 4.45LGGTITGIDD148 pKa = 3.65PGAGLTSLSEE158 pKa = 4.2QALEE162 pKa = 4.37TYY164 pKa = 10.84GLDD167 pKa = 4.52DD168 pKa = 3.7YY169 pKa = 11.4TLQTSSGAGMTAALDD184 pKa = 3.79RR185 pKa = 11.84AVGRR189 pKa = 11.84DD190 pKa = 3.14DD191 pKa = 4.21WIVVTGWSPHH201 pKa = 4.49WKK203 pKa = 9.81FGAYY207 pKa = 7.84EE208 pKa = 3.93LRR210 pKa = 11.84YY211 pKa = 10.44LEE213 pKa = 4.95DD214 pKa = 3.95PEE216 pKa = 4.75GALGGPEE223 pKa = 3.59RR224 pKa = 11.84VHH226 pKa = 7.2ALGRR230 pKa = 11.84AGFDD234 pKa = 2.87ADD236 pKa = 3.7YY237 pKa = 11.24PEE239 pKa = 4.71ISEE242 pKa = 4.34MLSRR246 pKa = 11.84MYY248 pKa = 11.01VPIDD252 pKa = 3.4EE253 pKa = 4.89LQDD256 pKa = 3.54YY257 pKa = 8.27MFEE260 pKa = 4.05ASEE263 pKa = 4.33TSFEE267 pKa = 4.34EE268 pKa = 4.23AVSAYY273 pKa = 9.7IDD275 pKa = 4.38DD276 pKa = 4.17NPDD279 pKa = 4.05RR280 pKa = 11.84IQYY283 pKa = 8.7WLTGEE288 pKa = 4.16LL289 pKa = 3.79
Molecular weight: 31.59 kDa
Isoelectric point according different methods:
Protein with the highest isoelectric point:
>tr|A0A6B8JW32|A0A6B8JW32_9GAMM Urea ABC transporter permease subunit UrtC OS=Spiribacter sp. 2438 OX=2666185 GN=urtC PE=4 SV=1
MM1 pKa = 7.45KK2 pKa = 9.51RR3 pKa = 11.84TFQPSVIKK11 pKa = 10.5RR12 pKa = 11.84KK13 pKa = 9.44RR14 pKa = 11.84NHH16 pKa = 5.44GFRR19 pKa = 11.84ARR21 pKa = 11.84MATRR25 pKa = 11.84NGRR28 pKa = 11.84KK29 pKa = 8.79ILARR33 pKa = 11.84RR34 pKa = 11.84RR35 pKa = 11.84AKK37 pKa = 10.33GRR39 pKa = 11.84ARR41 pKa = 11.84LTPP44 pKa = 3.93
MM1 pKa = 7.45KK2 pKa = 9.51RR3 pKa = 11.84TFQPSVIKK11 pKa = 10.5RR12 pKa = 11.84KK13 pKa = 9.44RR14 pKa = 11.84NHH16 pKa = 5.44GFRR19 pKa = 11.84ARR21 pKa = 11.84MATRR25 pKa = 11.84NGRR28 pKa = 11.84KK29 pKa = 8.79ILARR33 pKa = 11.84RR34 pKa = 11.84RR35 pKa = 11.84AKK37 pKa = 10.33GRR39 pKa = 11.84ARR41 pKa = 11.84LTPP44 pKa = 3.93
Molecular weight: 5.25 kDa
Isoelectric point according different methods:
Peptides (in silico digests for buttom-up proteomics)
Below you can find in silico digests of the whole proteome with Trypsin, Chymotrypsin, Trypsin+LysC, LysN, ArgC proteases suitable for different mass spec machines.| Try ESI |
 |
|---|
| ChTry ESI |
|
|---|
| ArgC ESI |
|
|---|
| LysN ESI |
|
|---|
| TryLysC ESI |
|
|---|
| Try MALDI |
|
|---|
| ChTry MALDI |
|
|---|
| ArgC MALDI |
|
|---|
| LysN MALDI |
|
|---|
| TryLysC MALDI |
|
|---|
| Try LTQ |
|
|---|
| ChTry LTQ |
|
|---|
| ArgC LTQ |
|
|---|
| LysN LTQ |
|
|---|
| TryLysC LTQ |
|
|---|
| Try MSlow |
|
|---|
| ChTry MSlow |
|
|---|
| ArgC MSlow |
|
|---|
| LysN MSlow |
|
|---|
| TryLysC MSlow |
|
|---|
| Try MShigh |
|
|---|
| ChTry MShigh |
|
|---|
| ArgC MShigh |
|
|---|
| LysN MShigh |
|
|---|
| TryLysC MShigh |
|
|---|
General Statistics
Number of major isoforms |
Number of additional isoforms |
Number of all proteins |
Number of amino acids |
Min. Seq. Length |
Max. Seq. Length |
Avg. Seq. Length |
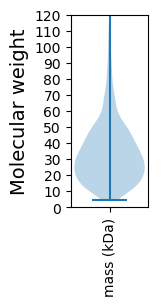
Avg. Mol. Weight |
|---|---|---|---|---|---|---|---|
0 |
596256 |
38 |
1835 |
325.8 |
35.61 |
Amino acid frequency
Ala |
Cys |
Asp |
Glu |
Phe |
Gly |
His |
Ile |
Lys |
Leu |
|---|---|---|---|---|---|---|---|---|---|
11.701 ± 0.068 | 0.876 ± 0.02 |
6.037 ± 0.049 | 6.461 ± 0.055 |
3.264 ± 0.032 | 8.701 ± 0.044 |
2.357 ± 0.027 | 4.646 ± 0.044 |
1.93 ± 0.038 | 10.903 ± 0.069 |
Met |
Asn |
Gln |
Pro |
Arg |
Ser |
Thr |
Val |
Trp |
Tyr |
|---|---|---|---|---|---|---|---|---|---|
2.393 ± 0.025 | 2.355 ± 0.027 |
5.281 ± 0.038 | 3.681 ± 0.032 |
8.229 ± 0.054 | 5.043 ± 0.034 |
4.893 ± 0.03 | 7.631 ± 0.047 |
1.402 ± 0.029 | 2.216 ± 0.023 |
Most of the basic statistics you can see at this page can be downloaded from this CSV file
See this proteome in:

Proteome-pI is available under Creative Commons Attribution-NoDerivs license, for more details see here
| Reference: Kozlowski LP. Proteome-pI 2.0: Proteome Isoelectric Point Database Update. Nucleic Acids Res. 2021, doi: 10.1093/nar/gkab944 | Contact: Lukasz P. Kozlowski |