Pseudorhodobacter sp. PARRP1
Taxonomy: cellular organisms; Bacteria; Proteobacteria; Alphaproteobacteria; Rhodobacterales; Rhodobacteraceae; Pseudorhodobacter; unclassified Pseudorhodobacter
Average proteome isoelectric point is 6.48
Get precalculated fractions of proteins

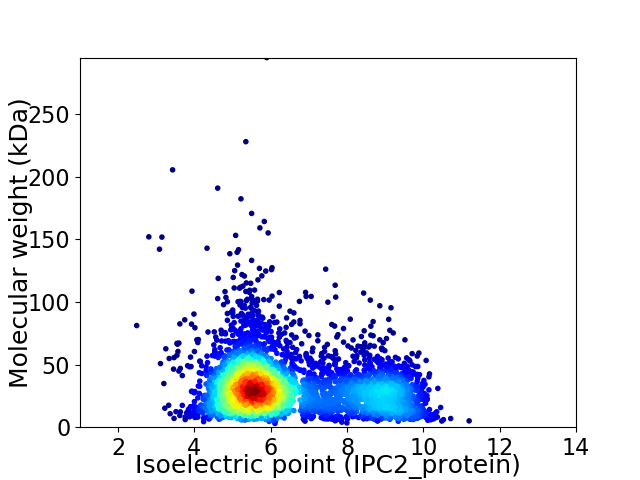
Virtual 2D-PAGE plot for 4111 proteins (isoelectric point calculated using IPC2_protein)
Get csv file with sequences according to given criteria:
* You can choose from 21 different methods for calculating isoelectric point
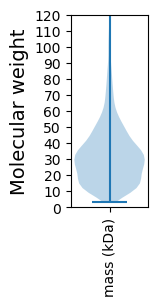
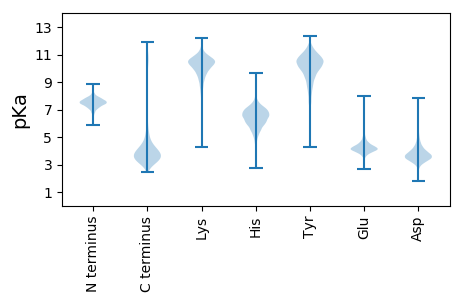
Summary statistics related to proteome-wise predictions


Protein with the lowest isoelectric point:
>tr|A0A257GIE0|A0A257GIE0_9RHOB ABC transporter permease OS=Pseudorhodobacter sp. PARRP1 OX=2015560 GN=CFE33_16535 PE=3 SV=1
MM1 pKa = 7.51PVISSSVSVSAINAHH16 pKa = 6.6ALTIAVAGNYY26 pKa = 9.97LITGPTYY33 pKa = 10.8LEE35 pKa = 4.55SEE37 pKa = 4.01SSYY40 pKa = 11.58AVGVNAGIGPVTINLAGSIVASLSYY65 pKa = 10.72YY66 pKa = 10.74GIYY69 pKa = 9.96QPGATDD75 pKa = 3.91PLTVNILSSGSIFGGAVVFATSQLALTNDD104 pKa = 3.71GYY106 pKa = 11.65LYY108 pKa = 10.88GQDD111 pKa = 3.61SGIASAPTATTNDD124 pKa = 3.32SVINRR129 pKa = 11.84GEE131 pKa = 3.92IFTTAGLAIDD141 pKa = 4.7LGGGADD147 pKa = 3.36VLVNSGHH154 pKa = 5.83ITGDD158 pKa = 3.32VNLGVGDD165 pKa = 3.67DD166 pKa = 3.48RR167 pKa = 11.84FYY169 pKa = 11.63GGGGSVLGTLDD180 pKa = 4.36LSTGNDD186 pKa = 3.89LIDD189 pKa = 4.38LRR191 pKa = 11.84GAQIDD196 pKa = 3.97GSVYY200 pKa = 10.64GGDD203 pKa = 3.7GNDD206 pKa = 3.21VFIVDD211 pKa = 4.53DD212 pKa = 4.45ASVDD216 pKa = 4.36LIEE219 pKa = 5.0YY220 pKa = 9.18SAQGTDD226 pKa = 3.45LVKK229 pKa = 10.4STVSYY234 pKa = 9.58EE235 pKa = 3.72LRR237 pKa = 11.84VNFEE241 pKa = 3.99NLTLLGAGDD250 pKa = 3.76INGTGNAAANTLTGNAGDD268 pKa = 4.2NRR270 pKa = 11.84LHH272 pKa = 7.32GYY274 pKa = 7.71TGNDD278 pKa = 3.06KK279 pKa = 11.02AYY281 pKa = 9.8GGSGDD286 pKa = 3.75DD287 pKa = 5.02VIYY290 pKa = 10.7GDD292 pKa = 3.56QGNDD296 pKa = 3.0VLYY299 pKa = 11.05GGIGVDD305 pKa = 4.1LLYY308 pKa = 11.16GGAGNDD314 pKa = 3.15ILRR317 pKa = 11.84GEE319 pKa = 4.27TGEE322 pKa = 4.28DD323 pKa = 3.31RR324 pKa = 11.84LIGGAGADD332 pKa = 3.83TLTGDD337 pKa = 3.12VGTAGGYY344 pKa = 10.69DD345 pKa = 3.47DD346 pKa = 5.57VFVFQRR352 pKa = 11.84VADD355 pKa = 3.97MPNAGSLDD363 pKa = 4.9LITDD367 pKa = 3.64FHH369 pKa = 8.26IGEE372 pKa = 4.47DD373 pKa = 4.18KK374 pKa = 10.77IDD376 pKa = 4.02LSAIDD381 pKa = 4.39AKK383 pKa = 11.11AGTLANDD390 pKa = 3.58AFSFVASFTSVAGQLIKK407 pKa = 10.44QASGLDD413 pKa = 3.55TLILGDD419 pKa = 3.68INGDD423 pKa = 3.26GVADD427 pKa = 4.37FRR429 pKa = 11.84ILLAGNVAVTAADD442 pKa = 4.89FILL445 pKa = 4.91
MM1 pKa = 7.51PVISSSVSVSAINAHH16 pKa = 6.6ALTIAVAGNYY26 pKa = 9.97LITGPTYY33 pKa = 10.8LEE35 pKa = 4.55SEE37 pKa = 4.01SSYY40 pKa = 11.58AVGVNAGIGPVTINLAGSIVASLSYY65 pKa = 10.72YY66 pKa = 10.74GIYY69 pKa = 9.96QPGATDD75 pKa = 3.91PLTVNILSSGSIFGGAVVFATSQLALTNDD104 pKa = 3.71GYY106 pKa = 11.65LYY108 pKa = 10.88GQDD111 pKa = 3.61SGIASAPTATTNDD124 pKa = 3.32SVINRR129 pKa = 11.84GEE131 pKa = 3.92IFTTAGLAIDD141 pKa = 4.7LGGGADD147 pKa = 3.36VLVNSGHH154 pKa = 5.83ITGDD158 pKa = 3.32VNLGVGDD165 pKa = 3.67DD166 pKa = 3.48RR167 pKa = 11.84FYY169 pKa = 11.63GGGGSVLGTLDD180 pKa = 4.36LSTGNDD186 pKa = 3.89LIDD189 pKa = 4.38LRR191 pKa = 11.84GAQIDD196 pKa = 3.97GSVYY200 pKa = 10.64GGDD203 pKa = 3.7GNDD206 pKa = 3.21VFIVDD211 pKa = 4.53DD212 pKa = 4.45ASVDD216 pKa = 4.36LIEE219 pKa = 5.0YY220 pKa = 9.18SAQGTDD226 pKa = 3.45LVKK229 pKa = 10.4STVSYY234 pKa = 9.58EE235 pKa = 3.72LRR237 pKa = 11.84VNFEE241 pKa = 3.99NLTLLGAGDD250 pKa = 3.76INGTGNAAANTLTGNAGDD268 pKa = 4.2NRR270 pKa = 11.84LHH272 pKa = 7.32GYY274 pKa = 7.71TGNDD278 pKa = 3.06KK279 pKa = 11.02AYY281 pKa = 9.8GGSGDD286 pKa = 3.75DD287 pKa = 5.02VIYY290 pKa = 10.7GDD292 pKa = 3.56QGNDD296 pKa = 3.0VLYY299 pKa = 11.05GGIGVDD305 pKa = 4.1LLYY308 pKa = 11.16GGAGNDD314 pKa = 3.15ILRR317 pKa = 11.84GEE319 pKa = 4.27TGEE322 pKa = 4.28DD323 pKa = 3.31RR324 pKa = 11.84LIGGAGADD332 pKa = 3.83TLTGDD337 pKa = 3.12VGTAGGYY344 pKa = 10.69DD345 pKa = 3.47DD346 pKa = 5.57VFVFQRR352 pKa = 11.84VADD355 pKa = 3.97MPNAGSLDD363 pKa = 4.9LITDD367 pKa = 3.64FHH369 pKa = 8.26IGEE372 pKa = 4.47DD373 pKa = 4.18KK374 pKa = 10.77IDD376 pKa = 4.02LSAIDD381 pKa = 4.39AKK383 pKa = 11.11AGTLANDD390 pKa = 3.58AFSFVASFTSVAGQLIKK407 pKa = 10.44QASGLDD413 pKa = 3.55TLILGDD419 pKa = 3.68INGDD423 pKa = 3.26GVADD427 pKa = 4.37FRR429 pKa = 11.84ILLAGNVAVTAADD442 pKa = 4.89FILL445 pKa = 4.91
Molecular weight: 44.85 kDa
Isoelectric point according different methods:
Protein with the highest isoelectric point:
>tr|A0A257GLE2|A0A257GLE2_9RHOB Flagellar hook-basal body protein FliE OS=Pseudorhodobacter sp. PARRP1 OX=2015560 GN=CFE33_13180 PE=3 SV=1
MM1 pKa = 7.45KK2 pKa = 9.61RR3 pKa = 11.84TFQPSNLVRR12 pKa = 11.84TRR14 pKa = 11.84RR15 pKa = 11.84HH16 pKa = 4.63GFRR19 pKa = 11.84ARR21 pKa = 11.84MATKK25 pKa = 10.34GGRR28 pKa = 11.84LVLAARR34 pKa = 11.84RR35 pKa = 11.84AKK37 pKa = 10.1GRR39 pKa = 11.84KK40 pKa = 8.83KK41 pKa = 10.63LSAA44 pKa = 3.95
MM1 pKa = 7.45KK2 pKa = 9.61RR3 pKa = 11.84TFQPSNLVRR12 pKa = 11.84TRR14 pKa = 11.84RR15 pKa = 11.84HH16 pKa = 4.63GFRR19 pKa = 11.84ARR21 pKa = 11.84MATKK25 pKa = 10.34GGRR28 pKa = 11.84LVLAARR34 pKa = 11.84RR35 pKa = 11.84AKK37 pKa = 10.1GRR39 pKa = 11.84KK40 pKa = 8.83KK41 pKa = 10.63LSAA44 pKa = 3.95
Molecular weight: 5.04 kDa
Isoelectric point according different methods:
Peptides (in silico digests for buttom-up proteomics)
Below you can find in silico digests of the whole proteome with Trypsin, Chymotrypsin, Trypsin+LysC, LysN, ArgC proteases suitable for different mass spec machines.| Try ESI |
 |
|---|
| ChTry ESI |
 |
|---|
| ArgC ESI |
 |
|---|
| LysN ESI |
 |
|---|
| TryLysC ESI |
 |
|---|
| Try MALDI |
 |
|---|
| ChTry MALDI |
 |
|---|
| ArgC MALDI |
 |
|---|
| LysN MALDI |
 |
|---|
| TryLysC MALDI |
 |
|---|
| Try LTQ |
 |
|---|
| ChTry LTQ |
 |
|---|
| ArgC LTQ |
 |
|---|
| LysN LTQ |
 |
|---|
| TryLysC LTQ |
 |
|---|
| Try MSlow |
 |
|---|
| ChTry MSlow |
 |
|---|
| ArgC MSlow |
 |
|---|
| LysN MSlow |
 |
|---|
| TryLysC MSlow |
 |
|---|
| Try MShigh |
 |
|---|
| ChTry MShigh |
 |
|---|
| ArgC MShigh |
 |
|---|
| LysN MShigh |
 |
|---|
| TryLysC MShigh |
 |
|---|
General Statistics
Number of major isoforms |
Number of additional isoforms |
Number of all proteins |
Number of amino acids |
Min. Seq. Length |
Max. Seq. Length |
Avg. Seq. Length |
Avg. Mol. Weight |
|---|---|---|---|---|---|---|---|
0 |
1288030 |
28 |
2742 |
313.3 |
33.75 |
Amino acid frequency
Ala |
Cys |
Asp |
Glu |
Phe |
Gly |
His |
Ile |
Lys |
Leu |
|---|---|---|---|---|---|---|---|---|---|
13.526 ± 0.06 | 0.871 ± 0.011 |
5.705 ± 0.028 | 5.035 ± 0.033 |
3.648 ± 0.023 | 8.804 ± 0.048 |
2.062 ± 0.023 | 5.124 ± 0.027 |
3.279 ± 0.033 | 10.284 ± 0.049 |
Met |
Asn |
Gln |
Pro |
Arg |
Ser |
Thr |
Val |
Trp |
Tyr |
|---|---|---|---|---|---|---|---|---|---|
2.783 ± 0.019 | 2.62 ± 0.022 |
5.14 ± 0.027 | 3.392 ± 0.021 |
6.33 ± 0.038 | 5.022 ± 0.029 |
5.476 ± 0.032 | 7.276 ± 0.034 |
1.421 ± 0.018 | 2.201 ± 0.02 |
Most of the basic statistics you can see at this page can be downloaded from this CSV file
Proteome-pI is available under Creative Commons Attribution-NoDerivs license, for more details see here
| Reference: Kozlowski LP. Proteome-pI 2.0: Proteome Isoelectric Point Database Update. Nucleic Acids Res. 2021, doi: 10.1093/nar/gkab944 | Contact: Lukasz P. Kozlowski |
