Beauveria bassiana (strain ARSEF 2860) (White muscardine disease fungus) (Tritirachium shiotae)
Taxonomy: cellular organisms; Eukaryota; Opisthokonta; Fungi; Dikarya; Ascomycota; saccharomyceta; Pezizomycotina; leotiomyceta; sordariomyceta; Sordariomycetes; Hypocreomycetidae; Hypocreales; Cordycipitaceae; Beauveria; Beauveria bassiana
Average proteome isoelectric point is 6.53
Get precalculated fractions of proteins

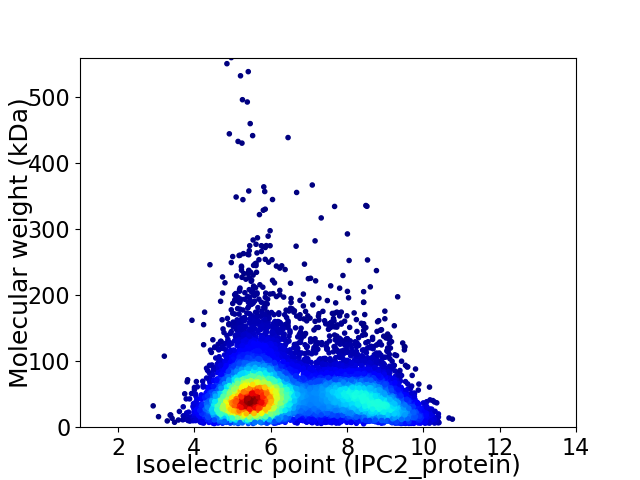
Virtual 2D-PAGE plot for 10363 proteins (isoelectric point calculated using IPC2_protein)
Get csv file with sequences according to given criteria:
* You can choose from 21 different methods for calculating isoelectric point
Summary statistics related to proteome-wise predictions


Protein with the lowest isoelectric point:
>tr|J5JI07|J5JI07_BEAB2 Protein transport protein SFT2 OS=Beauveria bassiana (strain ARSEF 2860) OX=655819 GN=BBA_08082 PE=3 SV=1
MM1 pKa = 7.81ADD3 pKa = 4.0APGQCTVLYY12 pKa = 9.2FAAASSYY19 pKa = 9.15TGKK22 pKa = 10.4EE23 pKa = 4.03SEE25 pKa = 4.67VFSAPTPLARR35 pKa = 11.84LLAAVEE41 pKa = 3.75ARR43 pKa = 11.84YY44 pKa = 9.11PGIRR48 pKa = 11.84ASVLDD53 pKa = 3.73SCLVTVNLDD62 pKa = 3.72YY63 pKa = 11.71VDD65 pKa = 4.22VPSGDD70 pKa = 3.87DD71 pKa = 3.38EE72 pKa = 4.79GVLIQAADD80 pKa = 3.9EE81 pKa = 4.26VAIIPPVSSGG91 pKa = 3.12
MM1 pKa = 7.81ADD3 pKa = 4.0APGQCTVLYY12 pKa = 9.2FAAASSYY19 pKa = 9.15TGKK22 pKa = 10.4EE23 pKa = 4.03SEE25 pKa = 4.67VFSAPTPLARR35 pKa = 11.84LLAAVEE41 pKa = 3.75ARR43 pKa = 11.84YY44 pKa = 9.11PGIRR48 pKa = 11.84ASVLDD53 pKa = 3.73SCLVTVNLDD62 pKa = 3.72YY63 pKa = 11.71VDD65 pKa = 4.22VPSGDD70 pKa = 3.87DD71 pKa = 3.38EE72 pKa = 4.79GVLIQAADD80 pKa = 3.9EE81 pKa = 4.26VAIIPPVSSGG91 pKa = 3.12
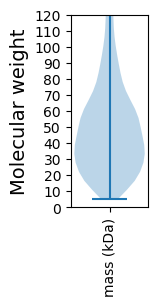
Molecular weight: 9.37 kDa
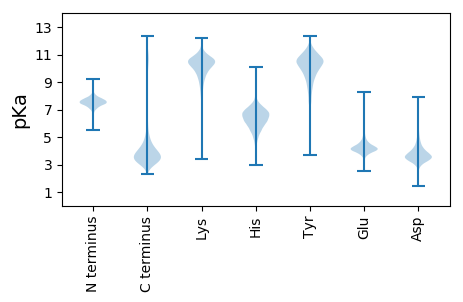
Isoelectric point according different methods:
Protein with the highest isoelectric point:
>tr|J4UGG7|J4UGG7_BEAB2 Glyoxalase-like protein OS=Beauveria bassiana (strain ARSEF 2860) OX=655819 GN=BBA_09103 PE=4 SV=1
MM1 pKa = 7.9LEE3 pKa = 4.07VTSSCFAPLISSTLLSFGGNLYY25 pKa = 9.78TPGCFAIQKK34 pKa = 7.74KK35 pKa = 8.0TSLLCTPYY43 pKa = 10.27RR44 pKa = 11.84CPATQSTPIASMLSAIPEE62 pKa = 4.26LACRR66 pKa = 11.84MRR68 pKa = 11.84SLAQSHH74 pKa = 5.28GHH76 pKa = 5.7DD77 pKa = 3.7VRR79 pKa = 11.84PEE81 pKa = 3.74VLTRR85 pKa = 11.84RR86 pKa = 11.84QVFITFSDD94 pKa = 3.65AKK96 pKa = 10.65SNAPPRR102 pKa = 11.84VTDD105 pKa = 4.98KK106 pKa = 10.76AAAWKK111 pKa = 9.88RR112 pKa = 11.84VQRR115 pKa = 11.84GFACLTRR122 pKa = 11.84FYY124 pKa = 11.09RR125 pKa = 11.84PLCPRR130 pKa = 11.84RR131 pKa = 11.84MSFLSSDD138 pKa = 3.45RR139 pKa = 11.84SLQRR143 pKa = 11.84DD144 pKa = 3.95PEE146 pKa = 4.43TAQPPLNVARR156 pKa = 11.84RR157 pKa = 11.84WGLQFRR163 pKa = 11.84FACSSQTICRR173 pKa = 11.84VAAIEE178 pKa = 4.37KK179 pKa = 9.71RR180 pKa = 11.84PSSASARR187 pKa = 11.84EE188 pKa = 4.18WTPKK192 pKa = 8.82LCIWFRR198 pKa = 11.84CITAIRR204 pKa = 11.84PRR206 pKa = 11.84KK207 pKa = 8.85VPRR210 pKa = 11.84IHH212 pKa = 6.82YY213 pKa = 8.08EE214 pKa = 3.93LVSAALPWSVSTDD227 pKa = 3.3SEE229 pKa = 4.31EE230 pKa = 4.18LSKK233 pKa = 10.28KK234 pKa = 7.7TSHH237 pKa = 5.95RR238 pKa = 11.84TSHH241 pKa = 5.75VAMSMSFRR249 pKa = 11.84LTSSMQRR256 pKa = 11.84PSSQAYY262 pKa = 8.4EE263 pKa = 4.19VLL265 pKa = 3.76
MM1 pKa = 7.9LEE3 pKa = 4.07VTSSCFAPLISSTLLSFGGNLYY25 pKa = 9.78TPGCFAIQKK34 pKa = 7.74KK35 pKa = 8.0TSLLCTPYY43 pKa = 10.27RR44 pKa = 11.84CPATQSTPIASMLSAIPEE62 pKa = 4.26LACRR66 pKa = 11.84MRR68 pKa = 11.84SLAQSHH74 pKa = 5.28GHH76 pKa = 5.7DD77 pKa = 3.7VRR79 pKa = 11.84PEE81 pKa = 3.74VLTRR85 pKa = 11.84RR86 pKa = 11.84QVFITFSDD94 pKa = 3.65AKK96 pKa = 10.65SNAPPRR102 pKa = 11.84VTDD105 pKa = 4.98KK106 pKa = 10.76AAAWKK111 pKa = 9.88RR112 pKa = 11.84VQRR115 pKa = 11.84GFACLTRR122 pKa = 11.84FYY124 pKa = 11.09RR125 pKa = 11.84PLCPRR130 pKa = 11.84RR131 pKa = 11.84MSFLSSDD138 pKa = 3.45RR139 pKa = 11.84SLQRR143 pKa = 11.84DD144 pKa = 3.95PEE146 pKa = 4.43TAQPPLNVARR156 pKa = 11.84RR157 pKa = 11.84WGLQFRR163 pKa = 11.84FACSSQTICRR173 pKa = 11.84VAAIEE178 pKa = 4.37KK179 pKa = 9.71RR180 pKa = 11.84PSSASARR187 pKa = 11.84EE188 pKa = 4.18WTPKK192 pKa = 8.82LCIWFRR198 pKa = 11.84CITAIRR204 pKa = 11.84PRR206 pKa = 11.84KK207 pKa = 8.85VPRR210 pKa = 11.84IHH212 pKa = 6.82YY213 pKa = 8.08EE214 pKa = 3.93LVSAALPWSVSTDD227 pKa = 3.3SEE229 pKa = 4.31EE230 pKa = 4.18LSKK233 pKa = 10.28KK234 pKa = 7.7TSHH237 pKa = 5.95RR238 pKa = 11.84TSHH241 pKa = 5.75VAMSMSFRR249 pKa = 11.84LTSSMQRR256 pKa = 11.84PSSQAYY262 pKa = 8.4EE263 pKa = 4.19VLL265 pKa = 3.76
Molecular weight: 29.82 kDa
Isoelectric point according different methods:
Peptides (in silico digests for buttom-up proteomics)
Below you can find in silico digests of the whole proteome with Trypsin, Chymotrypsin, Trypsin+LysC, LysN, ArgC proteases suitable for different mass spec machines.| Try ESI |
 |
|---|
| ChTry ESI |
 |
|---|
| ArgC ESI |
 |
|---|
| LysN ESI |
 |
|---|
| TryLysC ESI |
 |
|---|
| Try MALDI |
 |
|---|
| ChTry MALDI |
 |
|---|
| ArgC MALDI |
 |
|---|
| LysN MALDI |
 |
|---|
| TryLysC MALDI |
 |
|---|
| Try LTQ |
 |
|---|
| ChTry LTQ |
 |
|---|
| ArgC LTQ |
 |
|---|
| LysN LTQ |
 |
|---|
| TryLysC LTQ |
 |
|---|
| Try MSlow |
 |
|---|
| ChTry MSlow |
 |
|---|
| ArgC MSlow |
 |
|---|
| LysN MSlow |
 |
|---|
| TryLysC MSlow |
 |
|---|
| Try MShigh |
 |
|---|
| ChTry MShigh |
 |
|---|
| ArgC MShigh |
 |
|---|
| LysN MShigh |
 |
|---|
| TryLysC MShigh |
 |
|---|
General Statistics
Number of major isoforms |
Number of additional isoforms |
Number of all proteins |
Number of amino acids |
Min. Seq. Length |
Max. Seq. Length |
Avg. Seq. Length |
Avg. Mol. Weight |
|---|---|---|---|---|---|---|---|
0 |
5172183 |
50 |
5124 |
499.1 |
55.02 |
Amino acid frequency
Ala |
Cys |
Asp |
Glu |
Phe |
Gly |
His |
Ile |
Lys |
Leu |
|---|---|---|---|---|---|---|---|---|---|
9.62 ± 0.023 | 1.288 ± 0.008 |
5.883 ± 0.018 | 5.887 ± 0.022 |
3.62 ± 0.014 | 6.907 ± 0.021 |
2.44 ± 0.011 | 4.644 ± 0.015 |
4.69 ± 0.021 | 8.889 ± 0.026 |
Met |
Asn |
Gln |
Pro |
Arg |
Ser |
Thr |
Val |
Trp |
Tyr |
|---|---|---|---|---|---|---|---|---|---|
2.234 ± 0.009 | 3.508 ± 0.012 |
5.837 ± 0.02 | 4.082 ± 0.019 |
6.271 ± 0.02 | 8.035 ± 0.025 |
5.888 ± 0.015 | 6.177 ± 0.018 |
1.439 ± 0.008 | 2.66 ± 0.01 |
Most of the basic statistics you can see at this page can be downloaded from this CSV file
Proteome-pI is available under Creative Commons Attribution-NoDerivs license, for more details see here
| Reference: Kozlowski LP. Proteome-pI 2.0: Proteome Isoelectric Point Database Update. Nucleic Acids Res. 2021, doi: 10.1093/nar/gkab944 | Contact: Lukasz P. Kozlowski |
