Bat mastadenovirus
Taxonomy: Viruses; Varidnaviria; Bamfordvirae; Preplasmiviricota; Tectiliviricetes; Rowavirales; Adenoviridae; Mastadenovirus; unclassified Mastadenovirus
Average proteome isoelectric point is 6.36
Get precalculated fractions of proteins

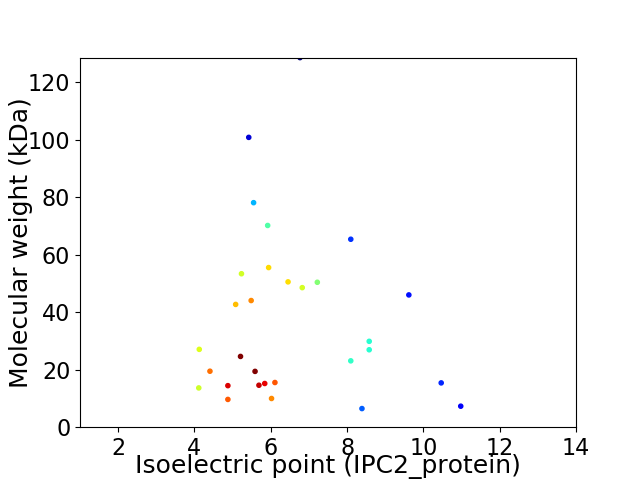
Virtual 2D-PAGE plot for 30 proteins (isoelectric point calculated using IPC2_protein)
Get csv file with sequences according to given criteria:
* You can choose from 21 different methods for calculating isoelectric point
Summary statistics related to proteome-wise predictions


Protein with the lowest isoelectric point:
>tr|A0A3G9EAM2|A0A3G9EAM2_9ADEN Pre-hexon-linking protein IIIa OS=Bat mastadenovirus OX=740971 PE=2 SV=1
MM1 pKa = 7.44KK2 pKa = 10.44VFTVPPSFDD11 pKa = 3.36LEE13 pKa = 4.42NYY15 pKa = 9.23VQGLLDD21 pKa = 4.29DD22 pKa = 4.4WRR24 pKa = 11.84PDD26 pKa = 3.3CCLGEE31 pKa = 4.19PCSRR35 pKa = 11.84SPSPPSLYY43 pKa = 10.65EE44 pKa = 4.32LFDD47 pKa = 3.79LTPPASPVLPCVPAAPDD64 pKa = 3.98SPPSSPVLCDD74 pKa = 3.16DD75 pKa = 5.05CYY77 pKa = 11.26FEE79 pKa = 6.32ADD81 pKa = 3.75EE82 pKa = 4.83VLSPCCTEE90 pKa = 3.87VSSTTEE96 pKa = 3.84VLSTPSVSPIPTPVLDD112 pKa = 3.69PTITEE117 pKa = 3.97EE118 pKa = 4.02MLLCLEE124 pKa = 4.7EE125 pKa = 4.45MPSFDD130 pKa = 5.83DD131 pKa = 3.57EE132 pKa = 5.03DD133 pKa = 4.02EE134 pKa = 4.41VRR136 pKa = 11.84SSSSSFEE143 pKa = 3.89HH144 pKa = 6.43WSGSLEE150 pKa = 4.18PASGPSMGCLRR161 pKa = 11.84CAFYY165 pKa = 10.55QDD167 pKa = 3.24RR168 pKa = 11.84GEE170 pKa = 4.51ASLCGLCYY178 pKa = 10.45LKK180 pKa = 10.81ALSEE184 pKa = 4.8VPFSMPKK191 pKa = 9.76RR192 pKa = 11.84SGAAEE197 pKa = 4.12EE198 pKa = 4.55EE199 pKa = 4.69VSSSEE204 pKa = 3.82SDD206 pKa = 3.69VIFVGQSKK214 pKa = 10.41RR215 pKa = 11.84KK216 pKa = 8.52SPCGFVSPAKK226 pKa = 9.85RR227 pKa = 11.84QKK229 pKa = 9.33TDD231 pKa = 2.79EE232 pKa = 4.43PLPVQTEE239 pKa = 4.01PLDD242 pKa = 4.45LSIKK246 pKa = 9.63PRR248 pKa = 11.84PEE250 pKa = 3.33
MM1 pKa = 7.44KK2 pKa = 10.44VFTVPPSFDD11 pKa = 3.36LEE13 pKa = 4.42NYY15 pKa = 9.23VQGLLDD21 pKa = 4.29DD22 pKa = 4.4WRR24 pKa = 11.84PDD26 pKa = 3.3CCLGEE31 pKa = 4.19PCSRR35 pKa = 11.84SPSPPSLYY43 pKa = 10.65EE44 pKa = 4.32LFDD47 pKa = 3.79LTPPASPVLPCVPAAPDD64 pKa = 3.98SPPSSPVLCDD74 pKa = 3.16DD75 pKa = 5.05CYY77 pKa = 11.26FEE79 pKa = 6.32ADD81 pKa = 3.75EE82 pKa = 4.83VLSPCCTEE90 pKa = 3.87VSSTTEE96 pKa = 3.84VLSTPSVSPIPTPVLDD112 pKa = 3.69PTITEE117 pKa = 3.97EE118 pKa = 4.02MLLCLEE124 pKa = 4.7EE125 pKa = 4.45MPSFDD130 pKa = 5.83DD131 pKa = 3.57EE132 pKa = 5.03DD133 pKa = 4.02EE134 pKa = 4.41VRR136 pKa = 11.84SSSSSFEE143 pKa = 3.89HH144 pKa = 6.43WSGSLEE150 pKa = 4.18PASGPSMGCLRR161 pKa = 11.84CAFYY165 pKa = 10.55QDD167 pKa = 3.24RR168 pKa = 11.84GEE170 pKa = 4.51ASLCGLCYY178 pKa = 10.45LKK180 pKa = 10.81ALSEE184 pKa = 4.8VPFSMPKK191 pKa = 9.76RR192 pKa = 11.84SGAAEE197 pKa = 4.12EE198 pKa = 4.55EE199 pKa = 4.69VSSSEE204 pKa = 3.82SDD206 pKa = 3.69VIFVGQSKK214 pKa = 10.41RR215 pKa = 11.84KK216 pKa = 8.52SPCGFVSPAKK226 pKa = 9.85RR227 pKa = 11.84QKK229 pKa = 9.33TDD231 pKa = 2.79EE232 pKa = 4.43PLPVQTEE239 pKa = 4.01PLDD242 pKa = 4.45LSIKK246 pKa = 9.63PRR248 pKa = 11.84PEE250 pKa = 3.33
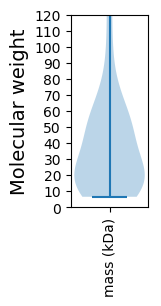
Molecular weight: 27.1 kDa
Isoelectric point according different methods:
Protein with the highest isoelectric point:
>tr|A0A3G9EWN5|A0A3G9EWN5_9ADEN U exon OS=Bat mastadenovirus OX=740971 PE=4 SV=1
MM1 pKa = 7.28ARR3 pKa = 11.84KK4 pKa = 9.29NVTLRR9 pKa = 11.84LRR11 pKa = 11.84LPVRR15 pKa = 11.84TRR17 pKa = 11.84LSGTGRR23 pKa = 11.84RR24 pKa = 11.84PRR26 pKa = 11.84RR27 pKa = 11.84TRR29 pKa = 11.84GMRR32 pKa = 11.84CGRR35 pKa = 11.84MKK37 pKa = 10.87GGFLPALIPLIAAAIGAVPGIASVALQAARR67 pKa = 11.84HH68 pKa = 4.96
MM1 pKa = 7.28ARR3 pKa = 11.84KK4 pKa = 9.29NVTLRR9 pKa = 11.84LRR11 pKa = 11.84LPVRR15 pKa = 11.84TRR17 pKa = 11.84LSGTGRR23 pKa = 11.84RR24 pKa = 11.84PRR26 pKa = 11.84RR27 pKa = 11.84TRR29 pKa = 11.84GMRR32 pKa = 11.84CGRR35 pKa = 11.84MKK37 pKa = 10.87GGFLPALIPLIAAAIGAVPGIASVALQAARR67 pKa = 11.84HH68 pKa = 4.96
Molecular weight: 7.31 kDa
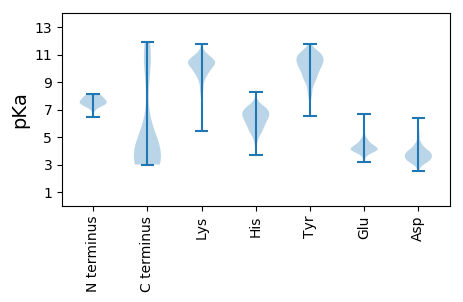
Isoelectric point according different methods:
Peptides (in silico digests for buttom-up proteomics)
Below you can find in silico digests of the whole proteome with Trypsin, Chymotrypsin, Trypsin+LysC, LysN, ArgC proteases suitable for different mass spec machines.| Try ESI |
 |
|---|
| ChTry ESI |
 |
|---|
| ArgC ESI |
 |
|---|
| LysN ESI |
 |
|---|
| TryLysC ESI |
 |
|---|
| Try MALDI |
 |
|---|
| ChTry MALDI |
 |
|---|
| ArgC MALDI |
 |
|---|
| LysN MALDI |
 |
|---|
| TryLysC MALDI |
 |
|---|
| Try LTQ |
 |
|---|
| ChTry LTQ |
 |
|---|
| ArgC LTQ |
 |
|---|
| LysN LTQ |
 |
|---|
| TryLysC LTQ |
 |
|---|
| Try MSlow |
 |
|---|
| ChTry MSlow |
 |
|---|
| ArgC MSlow |
 |
|---|
| LysN MSlow |
 |
|---|
| TryLysC MSlow |
 |
|---|
| Try MShigh |
 |
|---|
| ChTry MShigh |
 |
|---|
| ArgC MShigh |
 |
|---|
| LysN MShigh |
 |
|---|
| TryLysC MShigh |
 |
|---|
General Statistics
Number of major isoforms |
Number of additional isoforms |
Number of all proteins |
Number of amino acids |
Min. Seq. Length |
Max. Seq. Length |
Avg. Seq. Length |
Avg. Mol. Weight |
|---|---|---|---|---|---|---|---|
10069 |
55 |
1138 |
335.6 |
37.6 |
Amino acid frequency
Ala |
Cys |
Asp |
Glu |
Phe |
Gly |
His |
Ile |
Lys |
Leu |
|---|---|---|---|---|---|---|---|---|---|
7.737 ± 0.347 | 1.986 ± 0.357 |
4.837 ± 0.198 | 5.909 ± 0.491 |
4.171 ± 0.195 | 5.691 ± 0.31 |
2.096 ± 0.19 | 4.678 ± 0.204 |
4.648 ± 0.419 | 9.385 ± 0.39 |
Met |
Asn |
Gln |
Pro |
Arg |
Ser |
Thr |
Val |
Trp |
Tyr |
|---|---|---|---|---|---|---|---|---|---|
2.473 ± 0.203 | 5.115 ± 0.396 |
6.336 ± 0.331 | 4.4 ± 0.241 |
5.879 ± 0.529 | 7.091 ± 0.298 |
6.277 ± 0.334 | 6.555 ± 0.298 |
1.232 ± 0.091 | 3.506 ± 0.292 |
Most of the basic statistics you can see at this page can be downloaded from this CSV file
Proteome-pI is available under Creative Commons Attribution-NoDerivs license, for more details see here
| Reference: Kozlowski LP. Proteome-pI 2.0: Proteome Isoelectric Point Database Update. Nucleic Acids Res. 2021, doi: 10.1093/nar/gkab944 | Contact: Lukasz P. Kozlowski |
