Bordetella phage BPP-1
Taxonomy: Viruses; Duplodnaviria; Heunggongvirae; Uroviricota; Caudoviricetes; Caudovirales; Podoviridae; Rauchvirus
Average proteome isoelectric point is 6.43
Get precalculated fractions of proteins

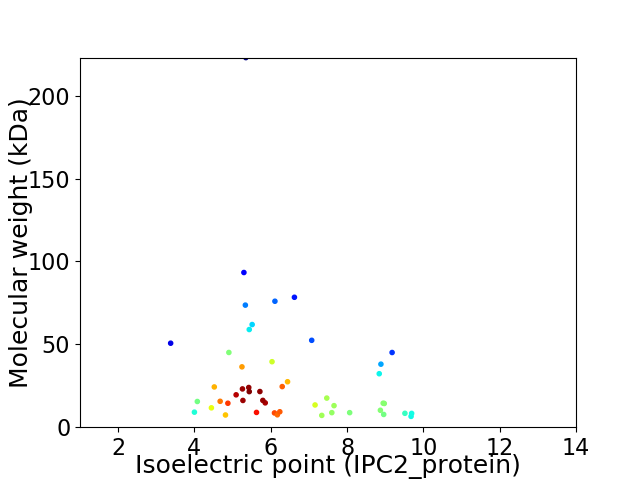
Virtual 2D-PAGE plot for 49 proteins (isoelectric point calculated using IPC2_protein)
Get csv file with sequences according to given criteria:
* You can choose from 21 different methods for calculating isoelectric point
Summary statistics related to proteome-wise predictions


Protein with the lowest isoelectric point:
>sp|Q775D6|FIBD_BPBPP Tail fiber receptor-binding protein OS=Bordetella phage BPP-1 OX=194699 GN=mtd PE=1 SV=1
MM1 pKa = 7.43SVQSTDD7 pKa = 3.4RR8 pKa = 11.84VAGPYY13 pKa = 9.06PCNGLTTQFPFDD25 pKa = 3.57FKK27 pKa = 11.36VFNTGEE33 pKa = 4.18VVAILSDD40 pKa = 3.62ADD42 pKa = 3.89GVEE45 pKa = 4.37STLTLGTDD53 pKa = 3.39YY54 pKa = 10.94TVALNDD60 pKa = 3.95NQDD63 pKa = 3.85SNPGGTLTTLATYY76 pKa = 8.18ATGYY80 pKa = 10.5KK81 pKa = 8.59ITLTSEE87 pKa = 4.27VPNTQPEE94 pKa = 4.44TLTNQGGFYY103 pKa = 10.28PKK105 pKa = 10.33VIEE108 pKa = 4.35HH109 pKa = 6.67ALDD112 pKa = 3.43RR113 pKa = 11.84LVIQIQQLADD123 pKa = 3.29KK124 pKa = 10.85LSRR127 pKa = 11.84TVQAPISGGLSSSEE141 pKa = 3.79ILEE144 pKa = 4.08QLAEE148 pKa = 3.98QLPLVSAVYY157 pKa = 10.08GHH159 pKa = 7.72LANIDD164 pKa = 3.41AVATNEE170 pKa = 3.85ADD172 pKa = 3.26IDD174 pKa = 4.04TVAASVGAVDD184 pKa = 4.66TVAGDD189 pKa = 4.96LGGTWAAGVSYY200 pKa = 10.67DD201 pKa = 3.95FGSIAVPPIGNTSPPGGNIVIVANSIGNVDD231 pKa = 3.7TVAEE235 pKa = 4.36NIGDD239 pKa = 3.65VSTVSTHH246 pKa = 6.03LSSMLAVANDD256 pKa = 3.24IDD258 pKa = 4.51SVVSVAGDD266 pKa = 3.74LEE268 pKa = 5.05NIDD271 pKa = 4.68AVADD275 pKa = 3.53NAANINTVAGANANVNTVASNILDD299 pKa = 3.67VGTVAGNIDD308 pKa = 4.01DD309 pKa = 4.26VQAVAGNAANINVVADD325 pKa = 3.47NADD328 pKa = 4.11NINATAANQANINAAVGNADD348 pKa = 4.1NINAAVANQANINAVVGNANNINAVAANEE377 pKa = 4.45GNVNTVVDD385 pKa = 4.14NLADD389 pKa = 3.71VQTVAGIAADD399 pKa = 3.52VSTVAEE405 pKa = 4.08NEE407 pKa = 4.0AAVAALGNDD416 pKa = 3.46LTGQPMVIDD425 pKa = 4.19YY426 pKa = 11.11GDD428 pKa = 4.81LSPASNPAAPAGVLGAVWANAEE450 pKa = 4.1NIAAVAEE457 pKa = 4.37NIAVIIEE464 pKa = 4.07AANNLPAILAALSGALVPANNLSDD488 pKa = 4.1LADD491 pKa = 3.99PAAARR496 pKa = 11.84ANIGLADD503 pKa = 4.26LGGIAA508 pKa = 5.16
MM1 pKa = 7.43SVQSTDD7 pKa = 3.4RR8 pKa = 11.84VAGPYY13 pKa = 9.06PCNGLTTQFPFDD25 pKa = 3.57FKK27 pKa = 11.36VFNTGEE33 pKa = 4.18VVAILSDD40 pKa = 3.62ADD42 pKa = 3.89GVEE45 pKa = 4.37STLTLGTDD53 pKa = 3.39YY54 pKa = 10.94TVALNDD60 pKa = 3.95NQDD63 pKa = 3.85SNPGGTLTTLATYY76 pKa = 8.18ATGYY80 pKa = 10.5KK81 pKa = 8.59ITLTSEE87 pKa = 4.27VPNTQPEE94 pKa = 4.44TLTNQGGFYY103 pKa = 10.28PKK105 pKa = 10.33VIEE108 pKa = 4.35HH109 pKa = 6.67ALDD112 pKa = 3.43RR113 pKa = 11.84LVIQIQQLADD123 pKa = 3.29KK124 pKa = 10.85LSRR127 pKa = 11.84TVQAPISGGLSSSEE141 pKa = 3.79ILEE144 pKa = 4.08QLAEE148 pKa = 3.98QLPLVSAVYY157 pKa = 10.08GHH159 pKa = 7.72LANIDD164 pKa = 3.41AVATNEE170 pKa = 3.85ADD172 pKa = 3.26IDD174 pKa = 4.04TVAASVGAVDD184 pKa = 4.66TVAGDD189 pKa = 4.96LGGTWAAGVSYY200 pKa = 10.67DD201 pKa = 3.95FGSIAVPPIGNTSPPGGNIVIVANSIGNVDD231 pKa = 3.7TVAEE235 pKa = 4.36NIGDD239 pKa = 3.65VSTVSTHH246 pKa = 6.03LSSMLAVANDD256 pKa = 3.24IDD258 pKa = 4.51SVVSVAGDD266 pKa = 3.74LEE268 pKa = 5.05NIDD271 pKa = 4.68AVADD275 pKa = 3.53NAANINTVAGANANVNTVASNILDD299 pKa = 3.67VGTVAGNIDD308 pKa = 4.01DD309 pKa = 4.26VQAVAGNAANINVVADD325 pKa = 3.47NADD328 pKa = 4.11NINATAANQANINAAVGNADD348 pKa = 4.1NINAAVANQANINAVVGNANNINAVAANEE377 pKa = 4.45GNVNTVVDD385 pKa = 4.14NLADD389 pKa = 3.71VQTVAGIAADD399 pKa = 3.52VSTVAEE405 pKa = 4.08NEE407 pKa = 4.0AAVAALGNDD416 pKa = 3.46LTGQPMVIDD425 pKa = 4.19YY426 pKa = 11.11GDD428 pKa = 4.81LSPASNPAAPAGVLGAVWANAEE450 pKa = 4.1NIAAVAEE457 pKa = 4.37NIAVIIEE464 pKa = 4.07AANNLPAILAALSGALVPANNLSDD488 pKa = 4.1LADD491 pKa = 3.99PAAARR496 pKa = 11.84ANIGLADD503 pKa = 4.26LGGIAA508 pKa = 5.16
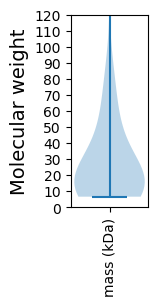
Molecular weight: 50.68 kDa
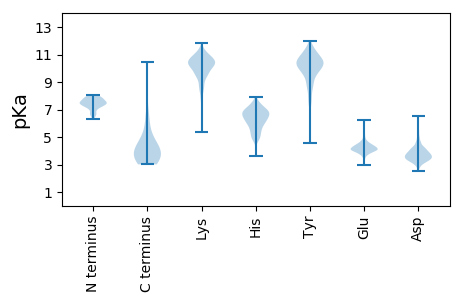
Isoelectric point according different methods:
Protein with the highest isoelectric point:
>tr|Q775A7|Q775A7_BPBPP Bbp38 OS=Bordetella phage BPP-1 OX=194699 GN=bbp38 PE=4 SV=1
MM1 pKa = 7.82KK2 pKa = 10.28NRR4 pKa = 11.84QPVQTTLPPEE14 pKa = 4.23AMRR17 pKa = 11.84LLQQAAQTPITRR29 pKa = 11.84ADD31 pKa = 3.25PLARR35 pKa = 11.84VKK37 pKa = 10.7AIEE40 pKa = 4.12KK41 pKa = 8.44ATEE44 pKa = 3.94RR45 pKa = 11.84VKK47 pKa = 10.66RR48 pKa = 11.84QYY50 pKa = 10.99PHH52 pKa = 6.84FFKK55 pKa = 10.82EE56 pKa = 4.04
MM1 pKa = 7.82KK2 pKa = 10.28NRR4 pKa = 11.84QPVQTTLPPEE14 pKa = 4.23AMRR17 pKa = 11.84LLQQAAQTPITRR29 pKa = 11.84ADD31 pKa = 3.25PLARR35 pKa = 11.84VKK37 pKa = 10.7AIEE40 pKa = 4.12KK41 pKa = 8.44ATEE44 pKa = 3.94RR45 pKa = 11.84VKK47 pKa = 10.66RR48 pKa = 11.84QYY50 pKa = 10.99PHH52 pKa = 6.84FFKK55 pKa = 10.82EE56 pKa = 4.04
Molecular weight: 6.53 kDa
Isoelectric point according different methods:
Peptides (in silico digests for buttom-up proteomics)
Below you can find in silico digests of the whole proteome with Trypsin, Chymotrypsin, Trypsin+LysC, LysN, ArgC proteases suitable for different mass spec machines.| Try ESI |
 |
|---|
| ChTry ESI |
 |
|---|
| ArgC ESI |
 |
|---|
| LysN ESI |
 |
|---|
| TryLysC ESI |
 |
|---|
| Try MALDI |
 |
|---|
| ChTry MALDI |
 |
|---|
| ArgC MALDI |
 |
|---|
| LysN MALDI |
 |
|---|
| TryLysC MALDI |
 |
|---|
| Try LTQ |
 |
|---|
| ChTry LTQ |
 |
|---|
| ArgC LTQ |
 |
|---|
| LysN LTQ |
 |
|---|
| TryLysC LTQ |
 |
|---|
| Try MSlow |
 |
|---|
| ChTry MSlow |
 |
|---|
| ArgC MSlow |
 |
|---|
| LysN MSlow |
 |
|---|
| TryLysC MSlow |
 |
|---|
| Try MShigh |
 |
|---|
| ChTry MShigh |
 |
|---|
| ArgC MShigh |
 |
|---|
| LysN MShigh |
 |
|---|
| TryLysC MShigh |
 |
|---|
General Statistics
Number of major isoforms |
Number of additional isoforms |
Number of all proteins |
Number of amino acids |
Min. Seq. Length |
Max. Seq. Length |
Avg. Seq. Length |
Avg. Mol. Weight |
|---|---|---|---|---|---|---|---|
0 |
13651 |
56 |
2052 |
278.6 |
30.29 |
Amino acid frequency
Ala |
Cys |
Asp |
Glu |
Phe |
Gly |
His |
Ile |
Lys |
Leu |
|---|---|---|---|---|---|---|---|---|---|
13.699 ± 0.538 | 0.769 ± 0.165 |
6.38 ± 0.241 | 5.685 ± 0.288 |
3.143 ± 0.146 | 8.241 ± 0.358 |
1.795 ± 0.17 | 3.978 ± 0.208 |
4.168 ± 0.276 | 8.556 ± 0.352 |
Met |
Asn |
Gln |
Pro |
Arg |
Ser |
Thr |
Val |
Trp |
Tyr |
|---|---|---|---|---|---|---|---|---|---|
2.212 ± 0.151 | 3.443 ± 0.389 |
4.688 ± 0.227 | 4.498 ± 0.436 |
6.637 ± 0.344 | 4.959 ± 0.261 |
6.102 ± 0.331 | 6.659 ± 0.312 |
1.641 ± 0.151 | 2.747 ± 0.182 |
Most of the basic statistics you can see at this page can be downloaded from this CSV file
Proteome-pI is available under Creative Commons Attribution-NoDerivs license, for more details see here
| Reference: Kozlowski LP. Proteome-pI 2.0: Proteome Isoelectric Point Database Update. Nucleic Acids Res. 2021, doi: 10.1093/nar/gkab944 | Contact: Lukasz P. Kozlowski |
