Phyllobacterium sp. YR620
Taxonomy: cellular organisms; Bacteria; Proteobacteria; Alphaproteobacteria; Hyphomicrobiales; Phyllobacteriaceae; Phyllobacterium; unclassified Phyllobacterium
Average proteome isoelectric point is 6.5
Get precalculated fractions of proteins

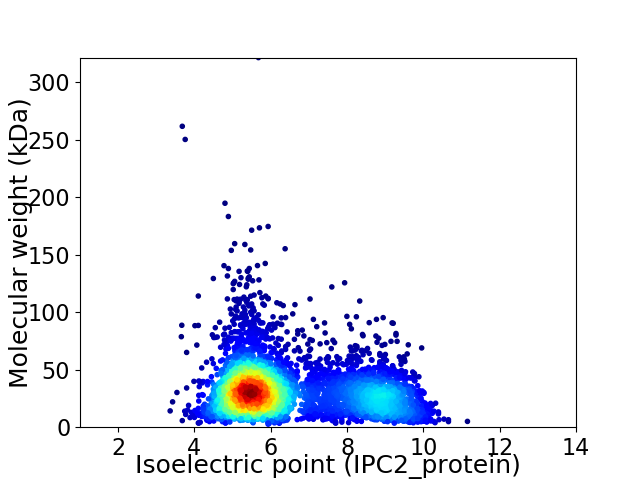
Virtual 2D-PAGE plot for 4392 proteins (isoelectric point calculated using IPC2_protein)
Get csv file with sequences according to given criteria:
* You can choose from 21 different methods for calculating isoelectric point
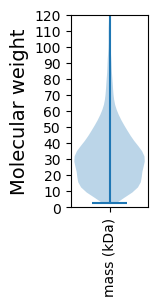
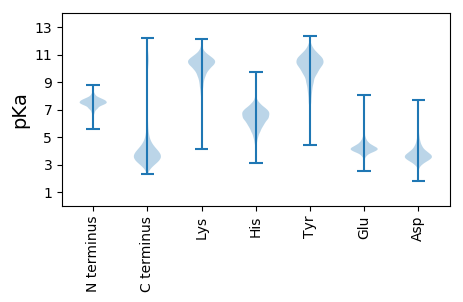
Summary statistics related to proteome-wise predictions


Protein with the lowest isoelectric point:
>tr|A0A1H0VLL3|A0A1H0VLL3_9RHIZ Prephenate dehydratase OS=Phyllobacterium sp. YR620 OX=1881066 GN=SAMN05428967_3496 PE=4 SV=1
MM1 pKa = 7.52SNSKK5 pKa = 10.48NNTYY9 pKa = 10.62NFHH12 pKa = 7.25PGGDD16 pKa = 3.73PSATADD22 pKa = 3.43ADD24 pKa = 3.72ASAVAAALALQLQGQAQGQLEE45 pKa = 4.3AQGQGQGQGQSQSQDD60 pKa = 3.1QHH62 pKa = 7.56SSSDD66 pKa = 3.34NSNWNGNGNLNGNGNLNGNGNLNANGNLNANLNEE100 pKa = 4.28SDD102 pKa = 3.41NHH104 pKa = 6.13NANTNTNTSDD114 pKa = 3.4TAVHH118 pKa = 6.07VDD120 pKa = 3.13VGVNLDD126 pKa = 4.01GYY128 pKa = 11.18LPTDD132 pKa = 3.52NDD134 pKa = 3.7FADD137 pKa = 4.85LDD139 pKa = 4.1LSHH142 pKa = 7.2TNFDD146 pKa = 3.5NMFITDD152 pKa = 3.58SGSINFDD159 pKa = 3.38PGNDD163 pKa = 3.35VHH165 pKa = 8.06FSDD168 pKa = 4.95IFNGAFNGAGTNTGFAINQVADD190 pKa = 4.2LVDD193 pKa = 3.9NDD195 pKa = 3.91QLSHH199 pKa = 6.52VSQDD203 pKa = 3.04NSGSVTLDD211 pKa = 3.13ATGGAATAGDD221 pKa = 4.68GIGSGADD228 pKa = 3.42GWDD231 pKa = 3.13SWFGNHH237 pKa = 6.6GGGAHH242 pKa = 7.02AGDD245 pKa = 4.56DD246 pKa = 4.02VAGSSAASAAANLTSTAFTQDD267 pKa = 2.4IVLGANLQQNAFDD280 pKa = 3.52ATVINGTYY288 pKa = 8.35THH290 pKa = 6.0TTISGDD296 pKa = 3.64SEE298 pKa = 4.27
MM1 pKa = 7.52SNSKK5 pKa = 10.48NNTYY9 pKa = 10.62NFHH12 pKa = 7.25PGGDD16 pKa = 3.73PSATADD22 pKa = 3.43ADD24 pKa = 3.72ASAVAAALALQLQGQAQGQLEE45 pKa = 4.3AQGQGQGQGQSQSQDD60 pKa = 3.1QHH62 pKa = 7.56SSSDD66 pKa = 3.34NSNWNGNGNLNGNGNLNGNGNLNANGNLNANLNEE100 pKa = 4.28SDD102 pKa = 3.41NHH104 pKa = 6.13NANTNTNTSDD114 pKa = 3.4TAVHH118 pKa = 6.07VDD120 pKa = 3.13VGVNLDD126 pKa = 4.01GYY128 pKa = 11.18LPTDD132 pKa = 3.52NDD134 pKa = 3.7FADD137 pKa = 4.85LDD139 pKa = 4.1LSHH142 pKa = 7.2TNFDD146 pKa = 3.5NMFITDD152 pKa = 3.58SGSINFDD159 pKa = 3.38PGNDD163 pKa = 3.35VHH165 pKa = 8.06FSDD168 pKa = 4.95IFNGAFNGAGTNTGFAINQVADD190 pKa = 4.2LVDD193 pKa = 3.9NDD195 pKa = 3.91QLSHH199 pKa = 6.52VSQDD203 pKa = 3.04NSGSVTLDD211 pKa = 3.13ATGGAATAGDD221 pKa = 4.68GIGSGADD228 pKa = 3.42GWDD231 pKa = 3.13SWFGNHH237 pKa = 6.6GGGAHH242 pKa = 7.02AGDD245 pKa = 4.56DD246 pKa = 4.02VAGSSAASAAANLTSTAFTQDD267 pKa = 2.4IVLGANLQQNAFDD280 pKa = 3.52ATVINGTYY288 pKa = 8.35THH290 pKa = 6.0TTISGDD296 pKa = 3.64SEE298 pKa = 4.27
Molecular weight: 30.2 kDa
Isoelectric point according different methods:
Protein with the highest isoelectric point:
>tr|A0A1H0VUD7|A0A1H0VUD7_9RHIZ TRAP-type C4-dicarboxylate transport system small permease component OS=Phyllobacterium sp. YR620 OX=1881066 GN=SAMN05428967_3679 PE=4 SV=1
MM1 pKa = 7.35KK2 pKa = 9.43RR3 pKa = 11.84TYY5 pKa = 10.27QPSKK9 pKa = 9.43LVRR12 pKa = 11.84ARR14 pKa = 11.84RR15 pKa = 11.84HH16 pKa = 4.38GFRR19 pKa = 11.84ARR21 pKa = 11.84MATAGGRR28 pKa = 11.84KK29 pKa = 9.15VIAARR34 pKa = 11.84RR35 pKa = 11.84ARR37 pKa = 11.84GRR39 pKa = 11.84KK40 pKa = 9.03RR41 pKa = 11.84LSAA44 pKa = 4.03
MM1 pKa = 7.35KK2 pKa = 9.43RR3 pKa = 11.84TYY5 pKa = 10.27QPSKK9 pKa = 9.43LVRR12 pKa = 11.84ARR14 pKa = 11.84RR15 pKa = 11.84HH16 pKa = 4.38GFRR19 pKa = 11.84ARR21 pKa = 11.84MATAGGRR28 pKa = 11.84KK29 pKa = 9.15VIAARR34 pKa = 11.84RR35 pKa = 11.84ARR37 pKa = 11.84GRR39 pKa = 11.84KK40 pKa = 9.03RR41 pKa = 11.84LSAA44 pKa = 4.03
Molecular weight: 5.05 kDa
Isoelectric point according different methods:
Peptides (in silico digests for buttom-up proteomics)
Below you can find in silico digests of the whole proteome with Trypsin, Chymotrypsin, Trypsin+LysC, LysN, ArgC proteases suitable for different mass spec machines.| Try ESI |
 |
|---|
| ChTry ESI |
 |
|---|
| ArgC ESI |
 |
|---|
| LysN ESI |
 |
|---|
| TryLysC ESI |
 |
|---|
| Try MALDI |
 |
|---|
| ChTry MALDI |
 |
|---|
| ArgC MALDI |
 |
|---|
| LysN MALDI |
 |
|---|
| TryLysC MALDI |
 |
|---|
| Try LTQ |
 |
|---|
| ChTry LTQ |
 |
|---|
| ArgC LTQ |
 |
|---|
| LysN LTQ |
 |
|---|
| TryLysC LTQ |
 |
|---|
| Try MSlow |
 |
|---|
| ChTry MSlow |
 |
|---|
| ArgC MSlow |
 |
|---|
| LysN MSlow |
 |
|---|
| TryLysC MSlow |
 |
|---|
| Try MShigh |
 |
|---|
| ChTry MShigh |
 |
|---|
| ArgC MShigh |
 |
|---|
| LysN MShigh |
 |
|---|
| TryLysC MShigh |
 |
|---|
General Statistics
Number of major isoforms |
Number of additional isoforms |
Number of all proteins |
Number of amino acids |
Min. Seq. Length |
Max. Seq. Length |
Avg. Seq. Length |
Avg. Mol. Weight |
|---|---|---|---|---|---|---|---|
0 |
1371109 |
25 |
2877 |
312.2 |
34.01 |
Amino acid frequency
Ala |
Cys |
Asp |
Glu |
Phe |
Gly |
His |
Ile |
Lys |
Leu |
|---|---|---|---|---|---|---|---|---|---|
11.561 ± 0.043 | 0.757 ± 0.012 |
5.752 ± 0.036 | 5.68 ± 0.034 |
3.961 ± 0.027 | 8.303 ± 0.039 |
2.021 ± 0.018 | 5.943 ± 0.025 |
4.017 ± 0.027 | 9.832 ± 0.041 |
Met |
Asn |
Gln |
Pro |
Arg |
Ser |
Thr |
Val |
Trp |
Tyr |
|---|---|---|---|---|---|---|---|---|---|
2.512 ± 0.016 | 3.09 ± 0.024 |
4.921 ± 0.025 | 3.099 ± 0.018 |
6.396 ± 0.037 | 5.74 ± 0.026 |
5.432 ± 0.025 | 7.285 ± 0.033 |
1.285 ± 0.015 | 2.415 ± 0.021 |
Most of the basic statistics you can see at this page can be downloaded from this CSV file
Proteome-pI is available under Creative Commons Attribution-NoDerivs license, for more details see here
| Reference: Kozlowski LP. Proteome-pI 2.0: Proteome Isoelectric Point Database Update. Nucleic Acids Res. 2021, doi: 10.1093/nar/gkab944 | Contact: Lukasz P. Kozlowski |
