Legionella drancourtii LLAP12
Taxonomy: cellular organisms; Bacteria; Proteobacteria; Gammaproteobacteria; Legionellales; Legionellaceae; Legionella; Legionella drancourtii
Average proteome isoelectric point is 6.84
Get precalculated fractions of proteins

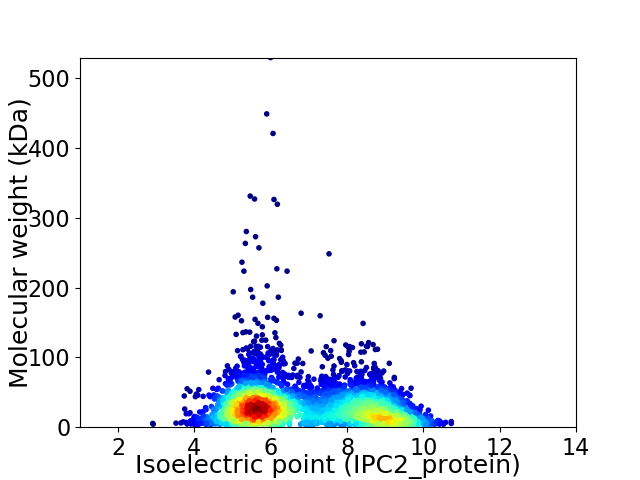
Virtual 2D-PAGE plot for 3959 proteins (isoelectric point calculated using IPC2_protein)
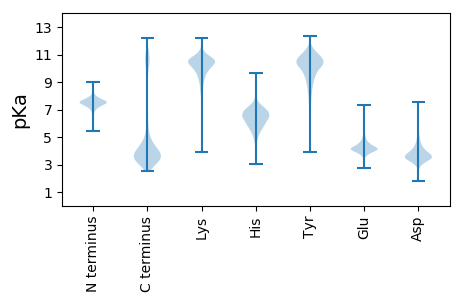
Get csv file with sequences according to given criteria:
* You can choose from 21 different methods for calculating isoelectric point
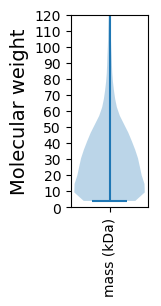
Summary statistics related to proteome-wise predictions


Protein with the lowest isoelectric point:
>tr|G9EKE5|G9EKE5_9GAMM Uncharacterized protein OS=Legionella drancourtii LLAP12 OX=658187 GN=LDG_5674 PE=4 SV=1
MM1 pKa = 7.79IFDD4 pKa = 4.0TGISGLQAASNNLDD18 pKa = 3.54VIGNNIANSSTVGFKK33 pKa = 10.62GSRR36 pKa = 11.84ANFGDD41 pKa = 3.54IYY43 pKa = 11.24SFGGYY48 pKa = 9.26GSSGTTPGGGVMLTSIQQSFASGTMTSTNNTLDD81 pKa = 3.75LAISGNGFFILNNQGATSYY100 pKa = 11.16SRR102 pKa = 11.84AGQFTLNNDD111 pKa = 3.28NYY113 pKa = 8.85ITNSSGQFLTGYY125 pKa = 10.04LADD128 pKa = 3.72AAGNITGASGNIQVNMANLSPKK150 pKa = 9.51ATTLVSTGLNLNSQSKK166 pKa = 9.89PPAADD171 pKa = 2.98WSGGAAPVTDD181 pKa = 4.44TYY183 pKa = 11.95NNTTSMTIYY192 pKa = 10.67DD193 pKa = 4.08SLGNSHH199 pKa = 6.36VLSMYY204 pKa = 10.67FIMADD209 pKa = 3.28STATAGQPDD218 pKa = 3.81AASPVGQTNQWYY230 pKa = 9.58VAFQIDD236 pKa = 4.0NQDD239 pKa = 3.07VPSIVTPGNSSNLFAANFNSDD260 pKa = 3.25GTFTSVQDD268 pKa = 3.75TTGTAIPTNLIPLSYY283 pKa = 10.3TLTNGANPLSLSIDD297 pKa = 3.64LSSCTQFGSPFAVQSANASGYY318 pKa = 5.85TTGSLAGLQVDD329 pKa = 3.83AAGVISGSYY338 pKa = 11.07SNGQTLAMGQIQLANFADD356 pKa = 4.56LNGLQNIGNVCWTATATSGQALIGTGGTGSFGTLLSGRR394 pKa = 11.84LEE396 pKa = 4.06EE397 pKa = 4.6SNVDD401 pKa = 3.15ITSEE405 pKa = 3.99LVDD408 pKa = 5.26LIGAQRR414 pKa = 11.84DD415 pKa = 3.97FQANAQTIRR424 pKa = 11.84AGDD427 pKa = 4.22TITQTIINIRR437 pKa = 3.51
MM1 pKa = 7.79IFDD4 pKa = 4.0TGISGLQAASNNLDD18 pKa = 3.54VIGNNIANSSTVGFKK33 pKa = 10.62GSRR36 pKa = 11.84ANFGDD41 pKa = 3.54IYY43 pKa = 11.24SFGGYY48 pKa = 9.26GSSGTTPGGGVMLTSIQQSFASGTMTSTNNTLDD81 pKa = 3.75LAISGNGFFILNNQGATSYY100 pKa = 11.16SRR102 pKa = 11.84AGQFTLNNDD111 pKa = 3.28NYY113 pKa = 8.85ITNSSGQFLTGYY125 pKa = 10.04LADD128 pKa = 3.72AAGNITGASGNIQVNMANLSPKK150 pKa = 9.51ATTLVSTGLNLNSQSKK166 pKa = 9.89PPAADD171 pKa = 2.98WSGGAAPVTDD181 pKa = 4.44TYY183 pKa = 11.95NNTTSMTIYY192 pKa = 10.67DD193 pKa = 4.08SLGNSHH199 pKa = 6.36VLSMYY204 pKa = 10.67FIMADD209 pKa = 3.28STATAGQPDD218 pKa = 3.81AASPVGQTNQWYY230 pKa = 9.58VAFQIDD236 pKa = 4.0NQDD239 pKa = 3.07VPSIVTPGNSSNLFAANFNSDD260 pKa = 3.25GTFTSVQDD268 pKa = 3.75TTGTAIPTNLIPLSYY283 pKa = 10.3TLTNGANPLSLSIDD297 pKa = 3.64LSSCTQFGSPFAVQSANASGYY318 pKa = 5.85TTGSLAGLQVDD329 pKa = 3.83AAGVISGSYY338 pKa = 11.07SNGQTLAMGQIQLANFADD356 pKa = 4.56LNGLQNIGNVCWTATATSGQALIGTGGTGSFGTLLSGRR394 pKa = 11.84LEE396 pKa = 4.06EE397 pKa = 4.6SNVDD401 pKa = 3.15ITSEE405 pKa = 3.99LVDD408 pKa = 5.26LIGAQRR414 pKa = 11.84DD415 pKa = 3.97FQANAQTIRR424 pKa = 11.84AGDD427 pKa = 4.22TITQTIINIRR437 pKa = 3.51
Molecular weight: 44.75 kDa
Isoelectric point according different methods:
Protein with the highest isoelectric point:
>tr|G9EK50|G9EK50_9GAMM Histidine biosynthesis bifunctional protein HisIE OS=Legionella drancourtii LLAP12 OX=658187 GN=hisI PE=3 SV=1
MM1 pKa = 7.45KK2 pKa = 9.61RR3 pKa = 11.84TFQPSNLKK11 pKa = 10.18RR12 pKa = 11.84KK13 pKa = 8.79RR14 pKa = 11.84DD15 pKa = 3.31HH16 pKa = 6.72GFRR19 pKa = 11.84EE20 pKa = 4.28RR21 pKa = 11.84MATRR25 pKa = 11.84AGRR28 pKa = 11.84LVIKK32 pKa = 10.41RR33 pKa = 11.84RR34 pKa = 11.84RR35 pKa = 11.84AKK37 pKa = 9.84GRR39 pKa = 11.84KK40 pKa = 8.85RR41 pKa = 11.84LSAA44 pKa = 3.96
MM1 pKa = 7.45KK2 pKa = 9.61RR3 pKa = 11.84TFQPSNLKK11 pKa = 10.18RR12 pKa = 11.84KK13 pKa = 8.79RR14 pKa = 11.84DD15 pKa = 3.31HH16 pKa = 6.72GFRR19 pKa = 11.84EE20 pKa = 4.28RR21 pKa = 11.84MATRR25 pKa = 11.84AGRR28 pKa = 11.84LVIKK32 pKa = 10.41RR33 pKa = 11.84RR34 pKa = 11.84RR35 pKa = 11.84AKK37 pKa = 9.84GRR39 pKa = 11.84KK40 pKa = 8.85RR41 pKa = 11.84LSAA44 pKa = 3.96
Molecular weight: 5.32 kDa
Isoelectric point according different methods:
Peptides (in silico digests for buttom-up proteomics)
Below you can find in silico digests of the whole proteome with Trypsin, Chymotrypsin, Trypsin+LysC, LysN, ArgC proteases suitable for different mass spec machines.| Try ESI |
 |
|---|
| ChTry ESI |
 |
|---|
| ArgC ESI |
 |
|---|
| LysN ESI |
 |
|---|
| TryLysC ESI |
 |
|---|
| Try MALDI |
 |
|---|
| ChTry MALDI |
 |
|---|
| ArgC MALDI |
 |
|---|
| LysN MALDI |
 |
|---|
| TryLysC MALDI |
 |
|---|
| Try LTQ |
 |
|---|
| ChTry LTQ |
 |
|---|
| ArgC LTQ |
 |
|---|
| LysN LTQ |
 |
|---|
| TryLysC LTQ |
 |
|---|
| Try MSlow |
 |
|---|
| ChTry MSlow |
 |
|---|
| ArgC MSlow |
 |
|---|
| LysN MSlow |
 |
|---|
| TryLysC MSlow |
 |
|---|
| Try MShigh |
 |
|---|
| ChTry MShigh |
 |
|---|
| ArgC MShigh |
 |
|---|
| LysN MShigh |
 |
|---|
| TryLysC MShigh |
 |
|---|
General Statistics
Number of major isoforms |
Number of additional isoforms |
Number of all proteins |
Number of amino acids |
Min. Seq. Length |
Max. Seq. Length |
Avg. Seq. Length |
Avg. Mol. Weight |
|---|---|---|---|---|---|---|---|
0 |
1146871 |
37 |
4687 |
289.7 |
32.52 |
Amino acid frequency
Ala |
Cys |
Asp |
Glu |
Phe |
Gly |
His |
Ile |
Lys |
Leu |
|---|---|---|---|---|---|---|---|---|---|
8.026 ± 0.042 | 1.183 ± 0.013 |
4.802 ± 0.029 | 5.916 ± 0.043 |
4.396 ± 0.028 | 5.853 ± 0.045 |
2.598 ± 0.019 | 7.303 ± 0.038 |
6.256 ± 0.046 | 10.969 ± 0.046 |
Met |
Asn |
Gln |
Pro |
Arg |
Ser |
Thr |
Val |
Trp |
Tyr |
|---|---|---|---|---|---|---|---|---|---|
2.439 ± 0.022 | 4.986 ± 0.031 |
4.028 ± 0.024 | 4.769 ± 0.039 |
4.196 ± 0.029 | 6.438 ± 0.03 |
5.393 ± 0.032 | 5.897 ± 0.036 |
1.12 ± 0.014 | 3.432 ± 0.025 |
Most of the basic statistics you can see at this page can be downloaded from this CSV file
Proteome-pI is available under Creative Commons Attribution-NoDerivs license, for more details see here
| Reference: Kozlowski LP. Proteome-pI 2.0: Proteome Isoelectric Point Database Update. Nucleic Acids Res. 2021, doi: 10.1093/nar/gkab944 | Contact: Lukasz P. Kozlowski |
