Aspergillus calidoustus
Taxonomy: cellular organisms; Eukaryota; Opisthokonta; Fungi; Dikarya; Ascomycota; saccharomyceta; Pezizomycotina; leotiomyceta; Eurotiomycetes; Eurotiomycetidae; Eurotiales; Aspergillaceae; Aspergillus; Aspergillus subgen. Nidulantes
Average proteome isoelectric point is 6.37
Get precalculated fractions of proteins

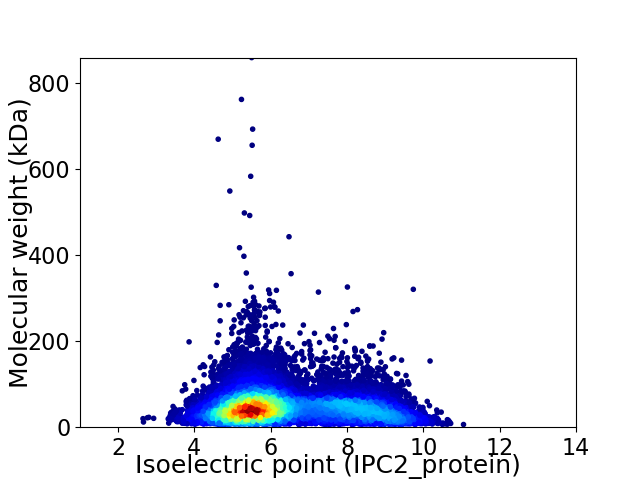
Virtual 2D-PAGE plot for 15359 proteins (isoelectric point calculated using IPC2_protein)
Get csv file with sequences according to given criteria:
* You can choose from 21 different methods for calculating isoelectric point
Summary statistics related to proteome-wise predictions


Protein with the lowest isoelectric point:
>tr|A0A0U5G0G1|A0A0U5G0G1_9EURO Uncharacterized protein OS=Aspergillus calidoustus OX=454130 GN=ASPCAL06346 PE=3 SV=1
MM1 pKa = 7.62HH2 pKa = 7.55SLTINLTLALFSLLTPTIHH21 pKa = 6.39AQNFTTFHH29 pKa = 7.68DD30 pKa = 4.18YY31 pKa = 11.27LSTYY35 pKa = 9.89IPNCILDD42 pKa = 3.99CTISAAEE49 pKa = 4.38RR50 pKa = 11.84DD51 pKa = 4.28TEE53 pKa = 4.28CGSGSVSSTDD63 pKa = 4.73ADD65 pKa = 6.15DD66 pKa = 5.06IDD68 pKa = 4.52CLCDD72 pKa = 4.73AFWHH76 pKa = 5.78TNGRR80 pKa = 11.84FVRR83 pKa = 11.84HH84 pKa = 5.99FSEE87 pKa = 4.48SMARR91 pKa = 11.84CVTDD95 pKa = 3.65ARR97 pKa = 11.84CSLDD101 pKa = 3.23EE102 pKa = 4.86LEE104 pKa = 5.17DD105 pKa = 3.72VARR108 pKa = 11.84VDD110 pKa = 3.07PWTLFDD116 pKa = 5.89GVDD119 pKa = 3.74GLCGGRR125 pKa = 11.84HH126 pKa = 5.03GHH128 pKa = 6.7DD129 pKa = 4.26HH130 pKa = 7.41DD131 pKa = 6.45HH132 pKa = 7.86DD133 pKa = 5.52DD134 pKa = 5.55DD135 pKa = 5.25SNNSNDD141 pKa = 4.91DD142 pKa = 3.33EE143 pKa = 4.7TSNSNSNNSNSSSNSDD159 pKa = 3.49DD160 pKa = 3.99TQDD163 pKa = 4.33SSSDD167 pKa = 3.59TANDD171 pKa = 3.56TSDD174 pKa = 3.38SSTSSSSNSGDD185 pKa = 3.78DD186 pKa = 3.86DD187 pKa = 4.06NGAASIASRR196 pKa = 11.84SITALAAGALVVLAAFF212 pKa = 4.8
MM1 pKa = 7.62HH2 pKa = 7.55SLTINLTLALFSLLTPTIHH21 pKa = 6.39AQNFTTFHH29 pKa = 7.68DD30 pKa = 4.18YY31 pKa = 11.27LSTYY35 pKa = 9.89IPNCILDD42 pKa = 3.99CTISAAEE49 pKa = 4.38RR50 pKa = 11.84DD51 pKa = 4.28TEE53 pKa = 4.28CGSGSVSSTDD63 pKa = 4.73ADD65 pKa = 6.15DD66 pKa = 5.06IDD68 pKa = 4.52CLCDD72 pKa = 4.73AFWHH76 pKa = 5.78TNGRR80 pKa = 11.84FVRR83 pKa = 11.84HH84 pKa = 5.99FSEE87 pKa = 4.48SMARR91 pKa = 11.84CVTDD95 pKa = 3.65ARR97 pKa = 11.84CSLDD101 pKa = 3.23EE102 pKa = 4.86LEE104 pKa = 5.17DD105 pKa = 3.72VARR108 pKa = 11.84VDD110 pKa = 3.07PWTLFDD116 pKa = 5.89GVDD119 pKa = 3.74GLCGGRR125 pKa = 11.84HH126 pKa = 5.03GHH128 pKa = 6.7DD129 pKa = 4.26HH130 pKa = 7.41DD131 pKa = 6.45HH132 pKa = 7.86DD133 pKa = 5.52DD134 pKa = 5.55DD135 pKa = 5.25SNNSNDD141 pKa = 4.91DD142 pKa = 3.33EE143 pKa = 4.7TSNSNSNNSNSSSNSDD159 pKa = 3.49DD160 pKa = 3.99TQDD163 pKa = 4.33SSSDD167 pKa = 3.59TANDD171 pKa = 3.56TSDD174 pKa = 3.38SSTSSSSNSGDD185 pKa = 3.78DD186 pKa = 3.86DD187 pKa = 4.06NGAASIASRR196 pKa = 11.84SITALAAGALVVLAAFF212 pKa = 4.8
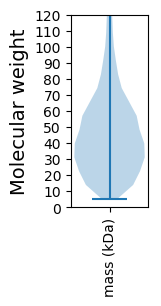
Molecular weight: 22.52 kDa
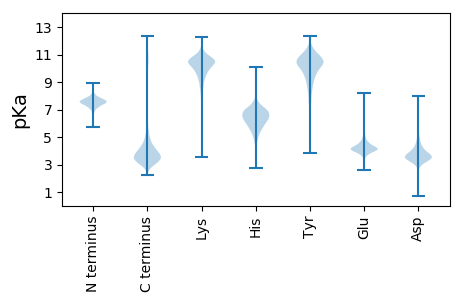
Isoelectric point according different methods:
Protein with the highest isoelectric point:
>tr|A0A0U5CLP4|A0A0U5CLP4_9EURO Uncharacterized protein OS=Aspergillus calidoustus OX=454130 GN=ASPCAL01859 PE=4 SV=1
MM1 pKa = 7.88PSHH4 pKa = 6.91KK5 pKa = 10.39SFRR8 pKa = 11.84TKK10 pKa = 10.45QKK12 pKa = 9.84LAKK15 pKa = 9.55AQKK18 pKa = 8.59QNRR21 pKa = 11.84PIPQWIRR28 pKa = 11.84LRR30 pKa = 11.84TGNTIRR36 pKa = 11.84YY37 pKa = 5.79NAKK40 pKa = 8.89RR41 pKa = 11.84RR42 pKa = 11.84HH43 pKa = 4.14WRR45 pKa = 11.84KK46 pKa = 7.41TRR48 pKa = 11.84LGII51 pKa = 4.46
MM1 pKa = 7.88PSHH4 pKa = 6.91KK5 pKa = 10.39SFRR8 pKa = 11.84TKK10 pKa = 10.45QKK12 pKa = 9.84LAKK15 pKa = 9.55AQKK18 pKa = 8.59QNRR21 pKa = 11.84PIPQWIRR28 pKa = 11.84LRR30 pKa = 11.84TGNTIRR36 pKa = 11.84YY37 pKa = 5.79NAKK40 pKa = 8.89RR41 pKa = 11.84RR42 pKa = 11.84HH43 pKa = 4.14WRR45 pKa = 11.84KK46 pKa = 7.41TRR48 pKa = 11.84LGII51 pKa = 4.46
Molecular weight: 6.25 kDa
Isoelectric point according different methods:
Peptides (in silico digests for buttom-up proteomics)
Below you can find in silico digests of the whole proteome with Trypsin, Chymotrypsin, Trypsin+LysC, LysN, ArgC proteases suitable for different mass spec machines.| Try ESI |
 |
|---|
| ChTry ESI |
 |
|---|
| ArgC ESI |
 |
|---|
| LysN ESI |
 |
|---|
| TryLysC ESI |
 |
|---|
| Try MALDI |
 |
|---|
| ChTry MALDI |
 |
|---|
| ArgC MALDI |
 |
|---|
| LysN MALDI |
 |
|---|
| TryLysC MALDI |
 |
|---|
| Try LTQ |
 |
|---|
| ChTry LTQ |
 |
|---|
| ArgC LTQ |
 |
|---|
| LysN LTQ |
 |
|---|
| TryLysC LTQ |
 |
|---|
| Try MSlow |
 |
|---|
| ChTry MSlow |
 |
|---|
| ArgC MSlow |
 |
|---|
| LysN MSlow |
 |
|---|
| TryLysC MSlow |
 |
|---|
| Try MShigh |
 |
|---|
| ChTry MShigh |
 |
|---|
| ArgC MShigh |
 |
|---|
| LysN MShigh |
 |
|---|
| TryLysC MShigh |
 |
|---|
General Statistics
Number of major isoforms |
Number of additional isoforms |
Number of all proteins |
Number of amino acids |
Min. Seq. Length |
Max. Seq. Length |
Avg. Seq. Length |
Avg. Mol. Weight |
|---|---|---|---|---|---|---|---|
7021788 |
51 |
7770 |
457.2 |
50.62 |
Amino acid frequency
Ala |
Cys |
Asp |
Glu |
Phe |
Gly |
His |
Ile |
Lys |
Leu |
|---|---|---|---|---|---|---|---|---|---|
8.645 ± 0.016 | 1.321 ± 0.008 |
5.579 ± 0.012 | 6.105 ± 0.018 |
3.772 ± 0.013 | 6.901 ± 0.018 |
2.456 ± 0.009 | 5.025 ± 0.013 |
4.298 ± 0.017 | 9.322 ± 0.023 |
Met |
Asn |
Gln |
Pro |
Arg |
Ser |
Thr |
Val |
Trp |
Tyr |
|---|---|---|---|---|---|---|---|---|---|
2.067 ± 0.008 | 3.529 ± 0.009 |
6.025 ± 0.019 | 3.941 ± 0.015 |
6.253 ± 0.017 | 8.114 ± 0.024 |
6.037 ± 0.014 | 6.208 ± 0.013 |
1.536 ± 0.008 | 2.864 ± 0.011 |
Most of the basic statistics you can see at this page can be downloaded from this CSV file
Proteome-pI is available under Creative Commons Attribution-NoDerivs license, for more details see here
| Reference: Kozlowski LP. Proteome-pI 2.0: Proteome Isoelectric Point Database Update. Nucleic Acids Res. 2021, doi: 10.1093/nar/gkab944 | Contact: Lukasz P. Kozlowski |
