CrAssphage ZA
Taxonomy: Viruses; Duplodnaviria; Heunggongvirae; Uroviricota; Caudoviricetes; Caudovirales; Podoviridae; unclassified Podoviridae; crAss-like viruses
Average proteome isoelectric point is 6.16
Get precalculated fractions of proteins

Virtual 2D-PAGE plot for 82 proteins (isoelectric point calculated using IPC2_protein)
Get csv file with sequences according to given criteria:
* You can choose from 21 different methods for calculating isoelectric point
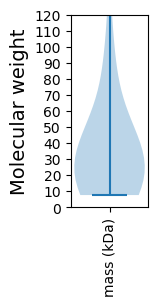
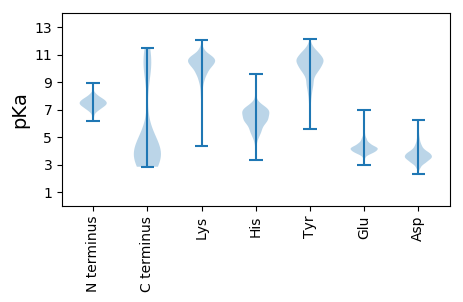
Summary statistics related to proteome-wise predictions


Protein with the lowest isoelectric point:
>tr|A0A654JCH0|A0A654JCH0_9CAUD Uncharacterized protein OS=CrAssphage ZA OX=2507125 PE=4 SV=1
MM1 pKa = 7.77ALVLVNNSTINIISIIMTINTSHH24 pKa = 6.78ANIAGGITNDD34 pKa = 3.48ILNILDD40 pKa = 3.91ITDD43 pKa = 3.65SLYY46 pKa = 10.97TNDD49 pKa = 4.12TLDD52 pKa = 4.21TIDD55 pKa = 3.38IYY57 pKa = 8.62YY58 pKa = 9.82TRR60 pKa = 11.84GKK62 pKa = 9.77LIPIAIMILVILII75 pKa = 4.01
MM1 pKa = 7.77ALVLVNNSTINIISIIMTINTSHH24 pKa = 6.78ANIAGGITNDD34 pKa = 3.48ILNILDD40 pKa = 3.91ITDD43 pKa = 3.65SLYY46 pKa = 10.97TNDD49 pKa = 4.12TLDD52 pKa = 4.21TIDD55 pKa = 3.38IYY57 pKa = 8.62YY58 pKa = 9.82TRR60 pKa = 11.84GKK62 pKa = 9.77LIPIAIMILVILII75 pKa = 4.01
Molecular weight: 8.2 kDa
Isoelectric point according different methods:
Protein with the highest isoelectric point:
>tr|A0A654JCJ8|A0A654JCJ8_9CAUD Putative integration host factor IHF subunit histone-like protein OS=CrAssphage ZA OX=2507125 PE=4 SV=1
MM1 pKa = 7.45MIQYY5 pKa = 10.18RR6 pKa = 11.84DD7 pKa = 3.44RR8 pKa = 11.84QRR10 pKa = 11.84QKK12 pKa = 11.26AFIGAIIGAAASIAGGIIKK31 pKa = 10.41GNKK34 pKa = 6.93QKK36 pKa = 10.76KK37 pKa = 8.6AQEE40 pKa = 4.06KK41 pKa = 9.7AQAEE45 pKa = 4.06AQAAQDD51 pKa = 4.57HH52 pKa = 6.93KK53 pKa = 11.39DD54 pKa = 3.36ALQNAQALTSAYY66 pKa = 10.47ANQDD70 pKa = 3.06YY71 pKa = 10.8VGQYY75 pKa = 9.84NDD77 pKa = 4.89KK78 pKa = 9.86LTLKK82 pKa = 10.6CGGRR86 pKa = 11.84VRR88 pKa = 11.84RR89 pKa = 11.84KK90 pKa = 10.2AGFGTEE96 pKa = 4.34FAQALPGLGNLASSITGVQGLGEE119 pKa = 5.0LGTAIGQGISANQQINEE136 pKa = 4.26NKK138 pKa = 10.27RR139 pKa = 11.84IAQEE143 pKa = 3.87AEE145 pKa = 3.67QRR147 pKa = 11.84KK148 pKa = 8.36QLQAGQQQLNITSDD162 pKa = 2.95KK163 pKa = 8.14MTNPMTMYY171 pKa = 10.1QRR173 pKa = 11.84SSFINKK179 pKa = 7.53YY180 pKa = 9.45KK181 pKa = 10.71CGGRR185 pKa = 11.84RR186 pKa = 11.84KK187 pKa = 9.61AWIGAAIGAAGSLIGGMFGSKK208 pKa = 9.45GQQPIQVKK216 pKa = 9.63QADD219 pKa = 3.89QASYY223 pKa = 10.54SAPKK227 pKa = 9.52TGLEE231 pKa = 3.85RR232 pKa = 11.84PEE234 pKa = 4.53WITNGNVQPSVMPQSVYY251 pKa = 10.4RR252 pKa = 11.84DD253 pKa = 3.32RR254 pKa = 11.84LNVYY258 pKa = 9.54RR259 pKa = 11.84CGGLRR264 pKa = 11.84RR265 pKa = 3.81
MM1 pKa = 7.45MIQYY5 pKa = 10.18RR6 pKa = 11.84DD7 pKa = 3.44RR8 pKa = 11.84QRR10 pKa = 11.84QKK12 pKa = 11.26AFIGAIIGAAASIAGGIIKK31 pKa = 10.41GNKK34 pKa = 6.93QKK36 pKa = 10.76KK37 pKa = 8.6AQEE40 pKa = 4.06KK41 pKa = 9.7AQAEE45 pKa = 4.06AQAAQDD51 pKa = 4.57HH52 pKa = 6.93KK53 pKa = 11.39DD54 pKa = 3.36ALQNAQALTSAYY66 pKa = 10.47ANQDD70 pKa = 3.06YY71 pKa = 10.8VGQYY75 pKa = 9.84NDD77 pKa = 4.89KK78 pKa = 9.86LTLKK82 pKa = 10.6CGGRR86 pKa = 11.84VRR88 pKa = 11.84RR89 pKa = 11.84KK90 pKa = 10.2AGFGTEE96 pKa = 4.34FAQALPGLGNLASSITGVQGLGEE119 pKa = 5.0LGTAIGQGISANQQINEE136 pKa = 4.26NKK138 pKa = 10.27RR139 pKa = 11.84IAQEE143 pKa = 3.87AEE145 pKa = 3.67QRR147 pKa = 11.84KK148 pKa = 8.36QLQAGQQQLNITSDD162 pKa = 2.95KK163 pKa = 8.14MTNPMTMYY171 pKa = 10.1QRR173 pKa = 11.84SSFINKK179 pKa = 7.53YY180 pKa = 9.45KK181 pKa = 10.71CGGRR185 pKa = 11.84RR186 pKa = 11.84KK187 pKa = 9.61AWIGAAIGAAGSLIGGMFGSKK208 pKa = 9.45GQQPIQVKK216 pKa = 9.63QADD219 pKa = 3.89QASYY223 pKa = 10.54SAPKK227 pKa = 9.52TGLEE231 pKa = 3.85RR232 pKa = 11.84PEE234 pKa = 4.53WITNGNVQPSVMPQSVYY251 pKa = 10.4RR252 pKa = 11.84DD253 pKa = 3.32RR254 pKa = 11.84LNVYY258 pKa = 9.54RR259 pKa = 11.84CGGLRR264 pKa = 11.84RR265 pKa = 3.81
Molecular weight: 28.62 kDa
Isoelectric point according different methods:
Peptides (in silico digests for buttom-up proteomics)
Below you can find in silico digests of the whole proteome with Trypsin, Chymotrypsin, Trypsin+LysC, LysN, ArgC proteases suitable for different mass spec machines.| Try ESI |
 |
|---|
| ChTry ESI |
 |
|---|
| ArgC ESI |
 |
|---|
| LysN ESI |
 |
|---|
| TryLysC ESI |
 |
|---|
| Try MALDI |
 |
|---|
| ChTry MALDI |
 |
|---|
| ArgC MALDI |
 |
|---|
| LysN MALDI |
 |
|---|
| TryLysC MALDI |
 |
|---|
| Try LTQ |
 |
|---|
| ChTry LTQ |
 |
|---|
| ArgC LTQ |
 |
|---|
| LysN LTQ |
 |
|---|
| TryLysC LTQ |
 |
|---|
| Try MSlow |
 |
|---|
| ChTry MSlow |
 |
|---|
| ArgC MSlow |
 |
|---|
| LysN MSlow |
 |
|---|
| TryLysC MSlow |
 |
|---|
| Try MShigh |
 |
|---|
| ChTry MShigh |
 |
|---|
| ArgC MShigh |
 |
|---|
| LysN MShigh |
 |
|---|
| TryLysC MShigh |
 |
|---|
General Statistics
Number of major isoforms |
Number of additional isoforms |
Number of all proteins |
Number of amino acids |
Min. Seq. Length |
Max. Seq. Length |
Avg. Seq. Length |
Avg. Mol. Weight |
|---|---|---|---|---|---|---|---|
0 |
30546 |
66 |
4091 |
372.5 |
42.36 |
Amino acid frequency
Ala |
Cys |
Asp |
Glu |
Phe |
Gly |
His |
Ile |
Lys |
Leu |
|---|---|---|---|---|---|---|---|---|---|
5.844 ± 0.301 | 1.054 ± 0.153 |
6.731 ± 0.217 | 6.142 ± 0.245 |
3.86 ± 0.178 | 6.06 ± 0.282 |
1.388 ± 0.111 | 8.803 ± 0.262 |
7.792 ± 0.272 | 7.019 ± 0.223 |
Met |
Asn |
Gln |
Pro |
Arg |
Ser |
Thr |
Val |
Trp |
Tyr |
|---|---|---|---|---|---|---|---|---|---|
2.013 ± 0.139 | 8.836 ± 0.33 |
2.753 ± 0.115 | 3.126 ± 0.198 |
4.112 ± 0.154 | 5.994 ± 0.379 |
6.119 ± 0.407 | 5.975 ± 0.197 |
1.113 ± 0.097 | 5.267 ± 0.211 |
Most of the basic statistics you can see at this page can be downloaded from this CSV file
Proteome-pI is available under Creative Commons Attribution-NoDerivs license, for more details see here
| Reference: Kozlowski LP. Proteome-pI 2.0: Proteome Isoelectric Point Database Update. Nucleic Acids Res. 2021, doi: 10.1093/nar/gkab944 | Contact: Lukasz P. Kozlowski |
